
Tag: Operational Technology

  • MLEP in KICS for Networks 5.0: how machine learning helps track network behavior of OT devices

    MLEP in KICS for Networks 5.0: how machine learning helps track network behavior of OT devices

    In an industrial network, malicious activity can be hard to tell apart from normal data exchange between devices. Malicious actors routinely rely on legitimate tools and the Living-off-the-Land technique, so a single network connection may show no known signs of an attack: the device uses a familiar protocol and transmits ordinary data. An anomaly can hide in subtle details: the data source, the time of access, or the volume of transferred data may be atypical for a particular device. However, to detect this kind of anomaly, you need to understand the roles of the devices at both ends of the connection and know which network activity patterns are typical for them.

    But an organization’s asset inventory data is often incomplete, which makes it harder to catch unauthorized connections in time. Suppose monitoring detects a host that regularly exchanges data with programmable logic controllers (PLCs). Its IP address is known, but the inventory does not specify what role it plays: is it an engineering workstation, a process data server, or a piece of contractor’s equipment? The host may also have been on the industrial network for a long time, with its record going out of date after a network upgrade.

    In the joint OT asset inventory guidance released by CISA and its partners in 2025, inventorying devices and classifying them by role are treated as part of OT asset management. For organizations, this is one of the most important areas: according to the SANS 2025 ICS security survey, 50% of respondents had deployed or significantly expanded ICS inventory and visibility tools over the previous 12 months, and 54% named them as investment priorities for the next 12–24 months.

    Device inventory in Kaspersky Industrial CyberSecurity for Networks

    In Kaspersky Industrial CyberSecurity for Networks, the Asset Discovery technology is the foundation of asset visibility. Passive network traffic analysis detects devices and their interactions, while recognition rules help determine the device category and extract available information about it, such as the vendor, model, or software version. Exactly which attributes the system can obtain depends on the protocol and the traffic it observes. We covered this in more detail at the Kaspersky Industrial Cybersecurity Conference.
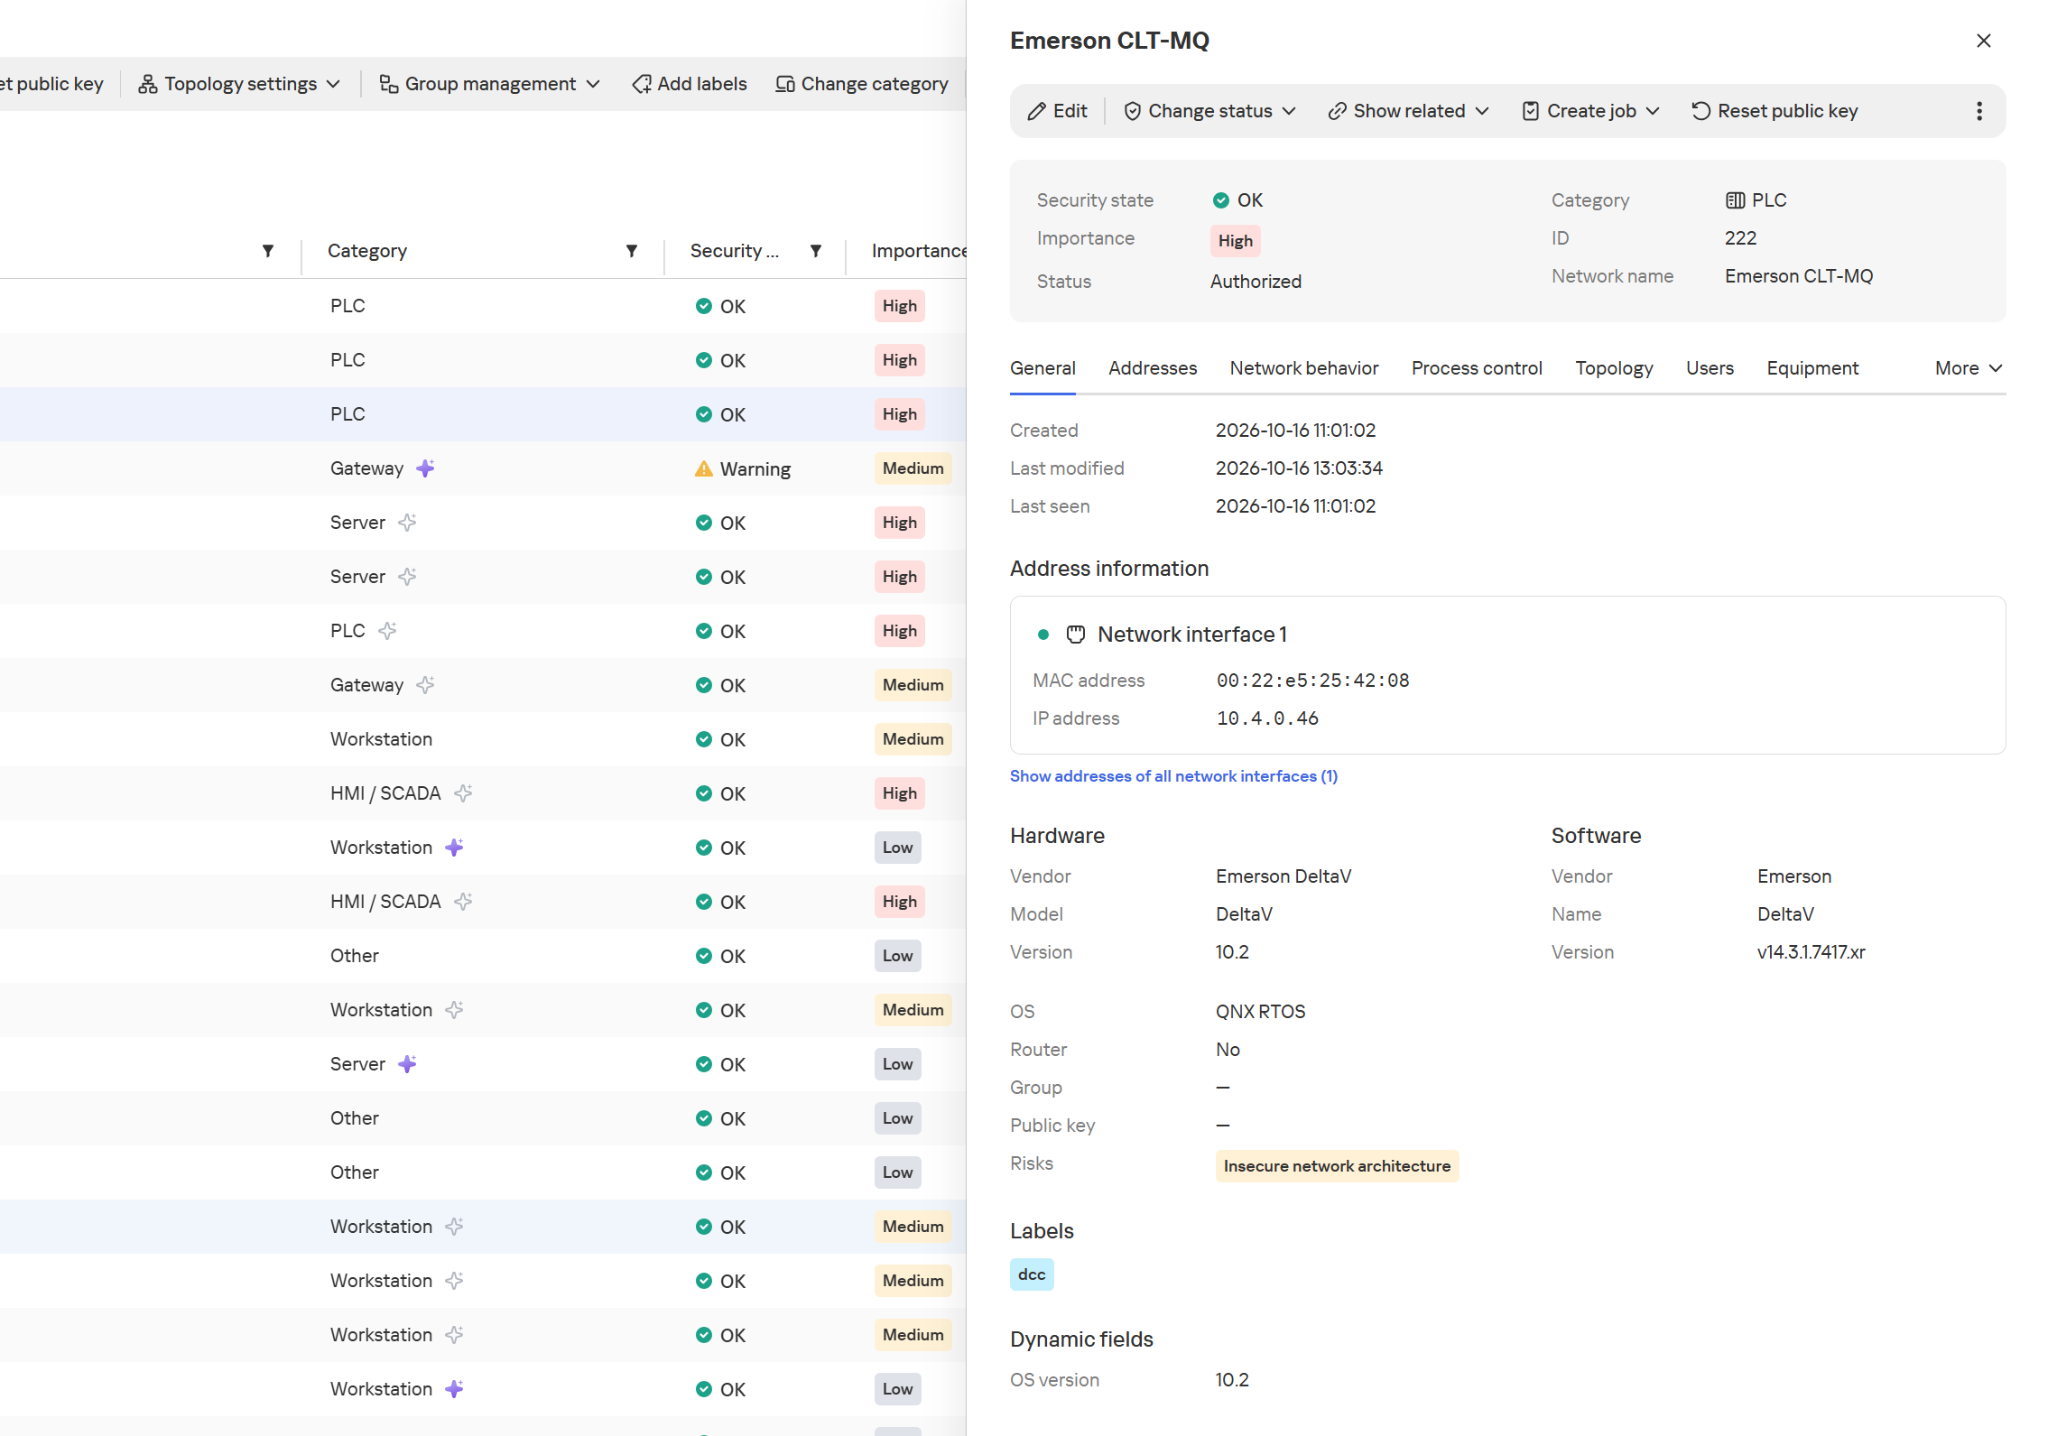
    Hardware and software information in the device card

    Hardware and software information in the device card

    The product also supports active polling modules (APMs): where polling is allowed, they can request additional configuration and firmware version details from devices. This kind of inventory is far more detailed than a list of IP addresses.
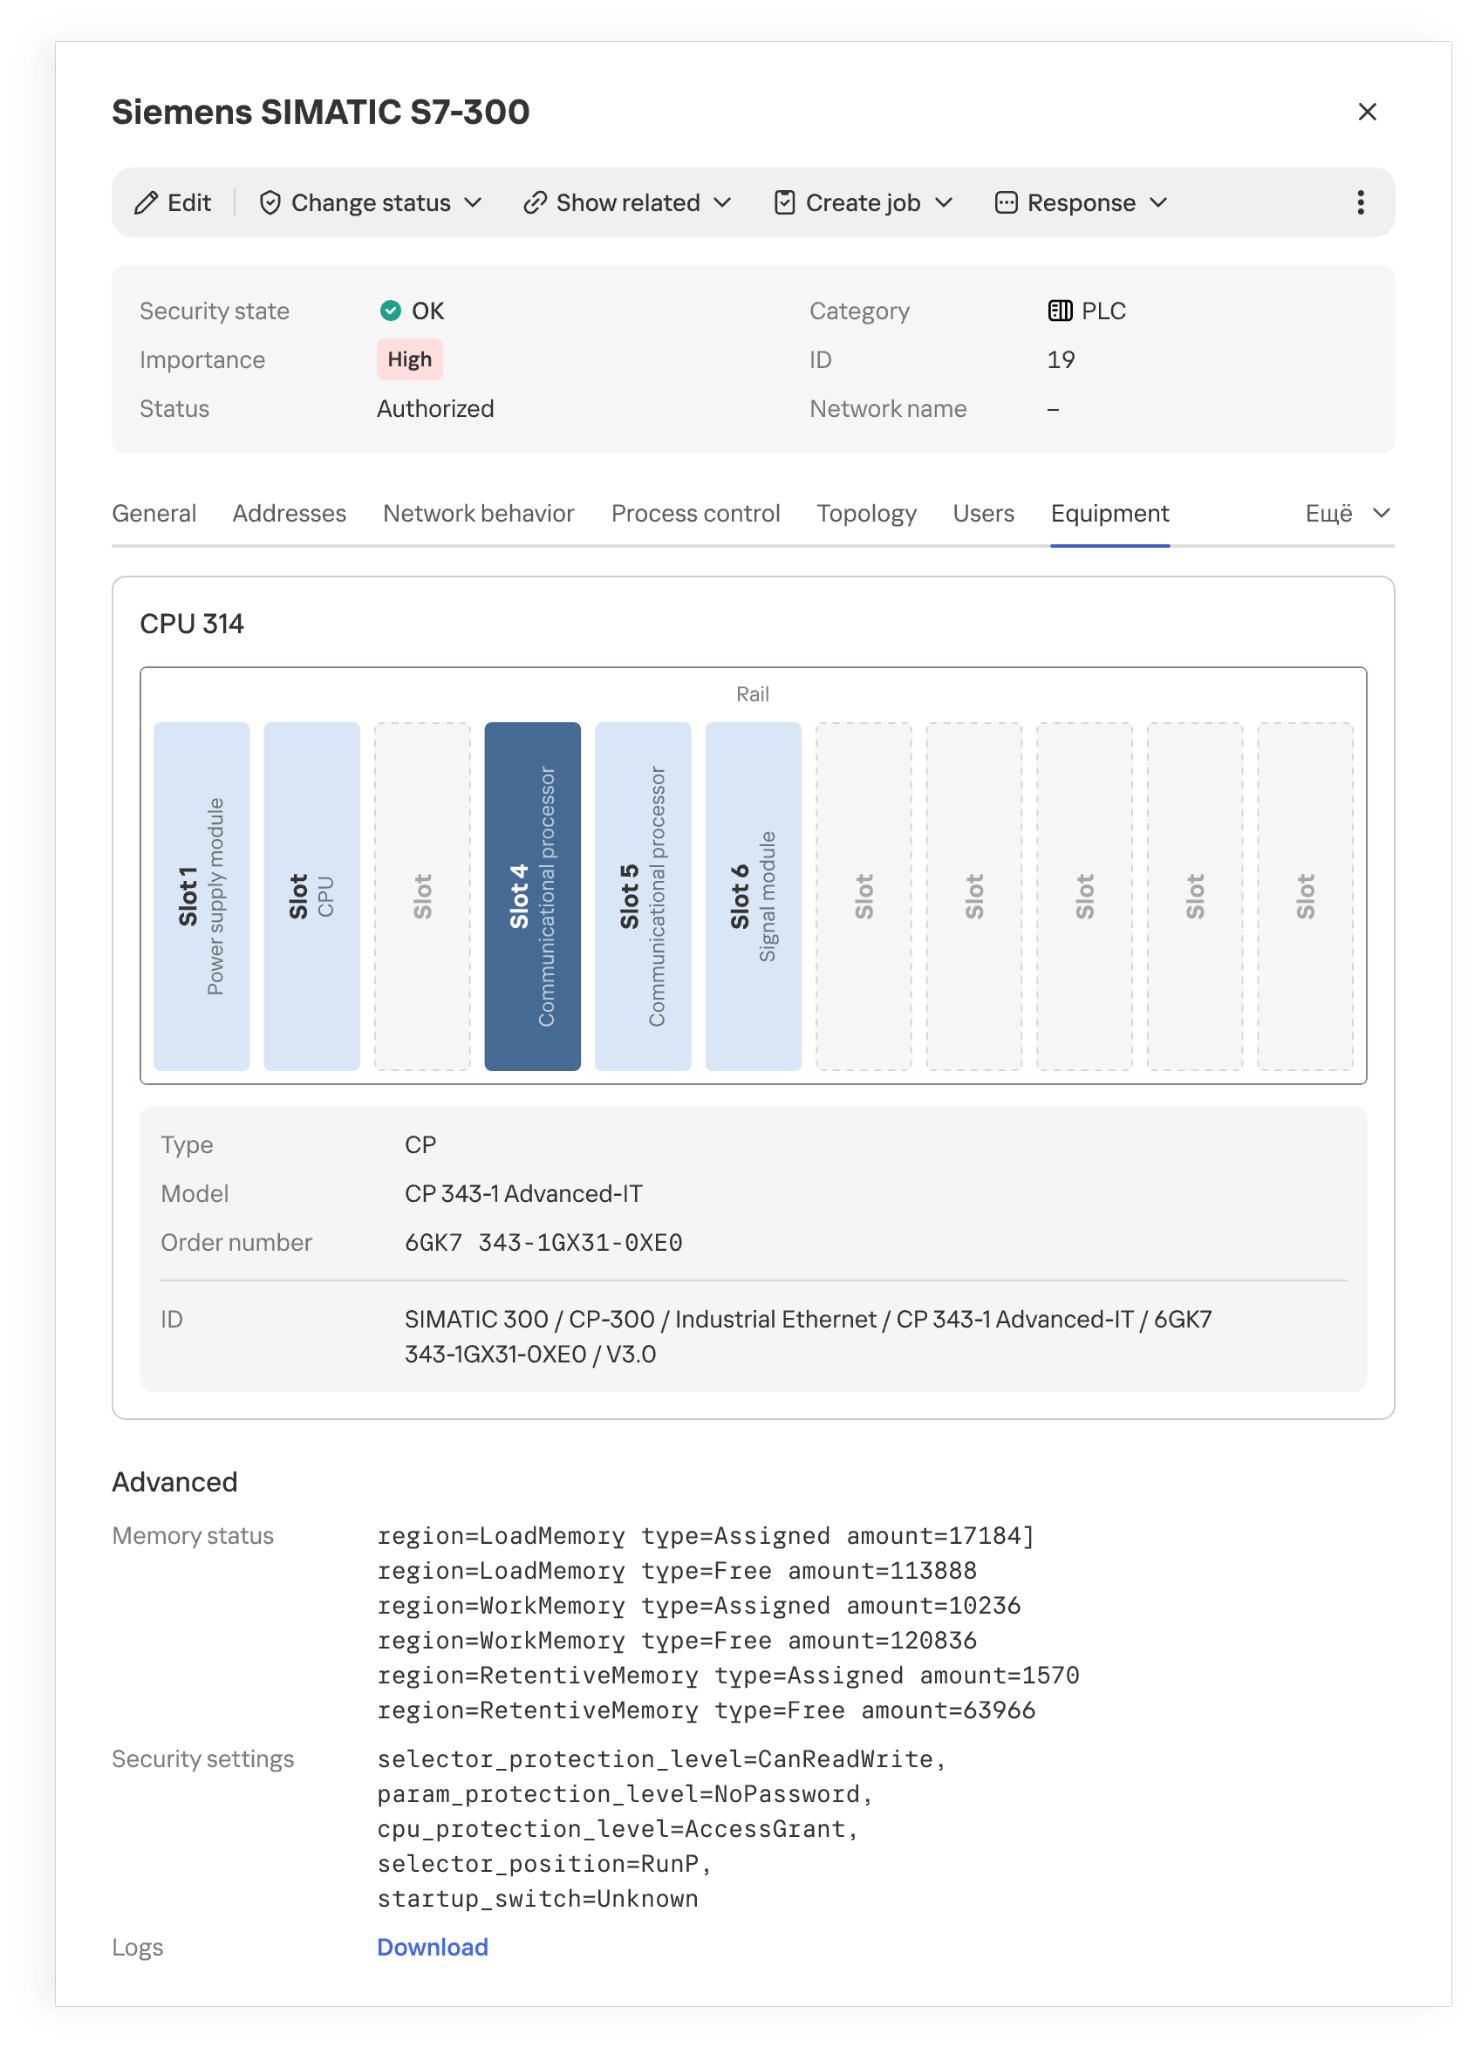
    Installed modules and their placement in a PLC rack

    Installed modules and their placement in a PLC rack

    However, even accurate hardware information doesn’t always explain what function a host performs in a specific industrial facility. Gaps appear for various reasons. Some devices send identifying information only at startup or during configuration, while others rarely communicate. Proprietary protocols can’t always be parsed, and encryption may leave only connection metadata for analysis. If the monitoring system doesn’t receive traffic from every segment of the industrial network, some network activity goes unobserved. Active polling doesn’t suit every device or every operating condition.
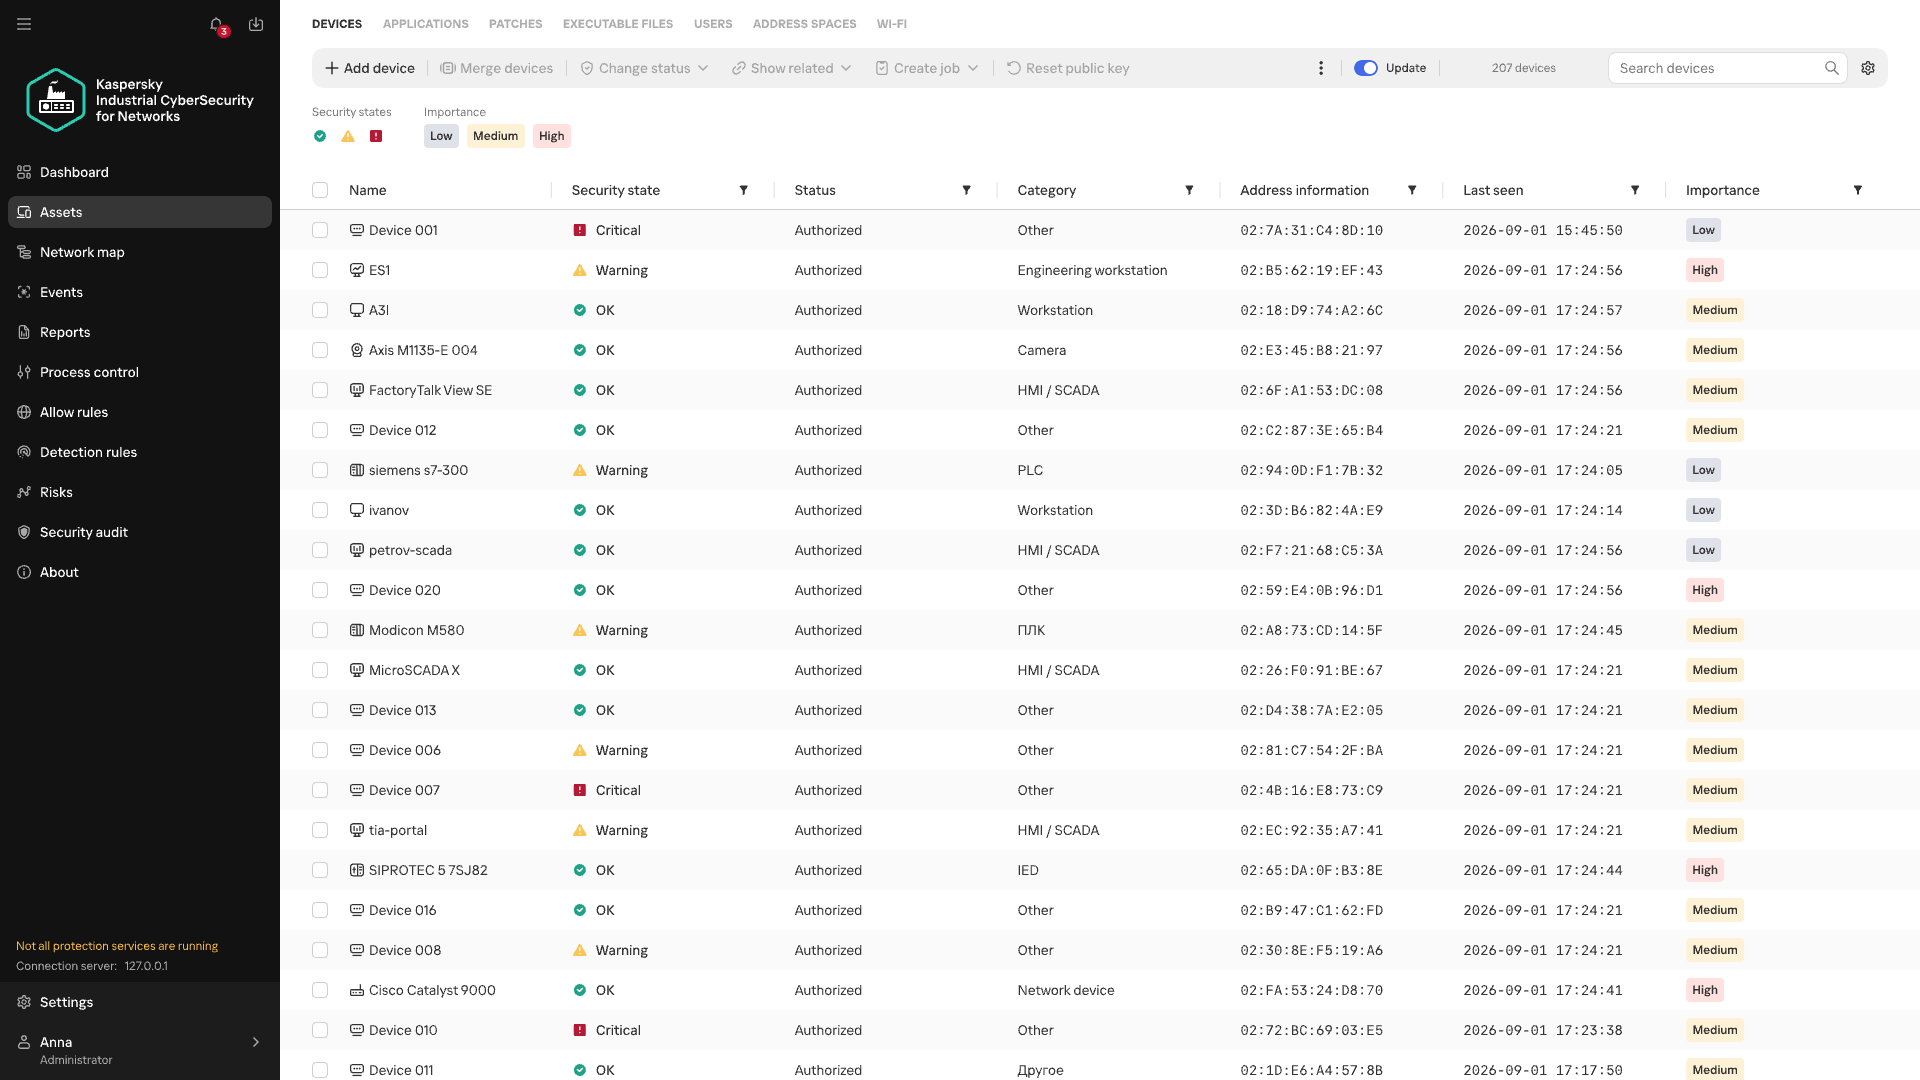
    Devices of unknown category

    Devices of unknown category

    When there isn’t enough direct information about a device, its category can be refined by looking at the patterns of its recurring network interactions. Analyzing these interactions is the job of Machine Learning Event Processor (MLEP), a service included in Kaspersky Industrial CyberSecurity for Networks 5.0. This machine-learning-based event processor can both refine device categories and detect anomalies in their network behavior.

    What data does MLEP analyze?

    To compare device behavior, you don’t need to store every packet as a separate observation (a data object) in the ML model. MLEP represents network sessions as a sequence of short 15-second fragments. For each fragment, MLEP stores information about the endpoints (IP, MAC, and port), the direction of data exchange, the protocol, and the number and size of the packets transmitted. Together these make up an event, which then gets a timestamp. Traffic thus becomes a sequence of events showing which hosts a device communicated with, when, and how communication intensity changed.

    Aggregating data into events also sets the method’s limits. An aggregated fragment can’t be used to reconstruct the exact order of individual packets or the content of commands. MLEP can draw conclusions about a new protocol only if another KICS technology has managed to recognize it. That said, comparing stable network connections and changes in exchange volume doesn’t require a detailed record of every packet. These observations form the basis of the device’s behavioral history.

    From observations to MLEP results

    Each object has its own behavioral history, and one object’s history can’t be applied to another. But the principles of behavior analysis, along with some common rules, work across different objects.

    Let’s look at how this works in MLEP, which is built on a spiking neural semantic network (NSN).

    Event identification

    Neurosemantic networks structure information as a multilayer ordered graph, where the data in each consecutive layer builds on the data in the previous one. The nodes of this graph — that is, the units of information in each layer — act as neurons.The NSN creates dedicated channels to handle different event parameters (port, IP, and so on). Unique parameter values for each channel are stored as neurons in layer 0. The event itself, which consists of a set of parameter values, is stored as a neuron in layer 1 of the network. If an event occurs for the first time, neurogenesis creates a new neuron with input connections to the corresponding parameter neurons. This lets the network learn and operate on the event stream at the same time. If the event has occurred before, the network activates the same neuron that was created when the event first appeared. This way, the network identifies each event precisely. Each neuron that corresponds to an event also collects basic statistics: when it was last activated and how many times it has been activated.
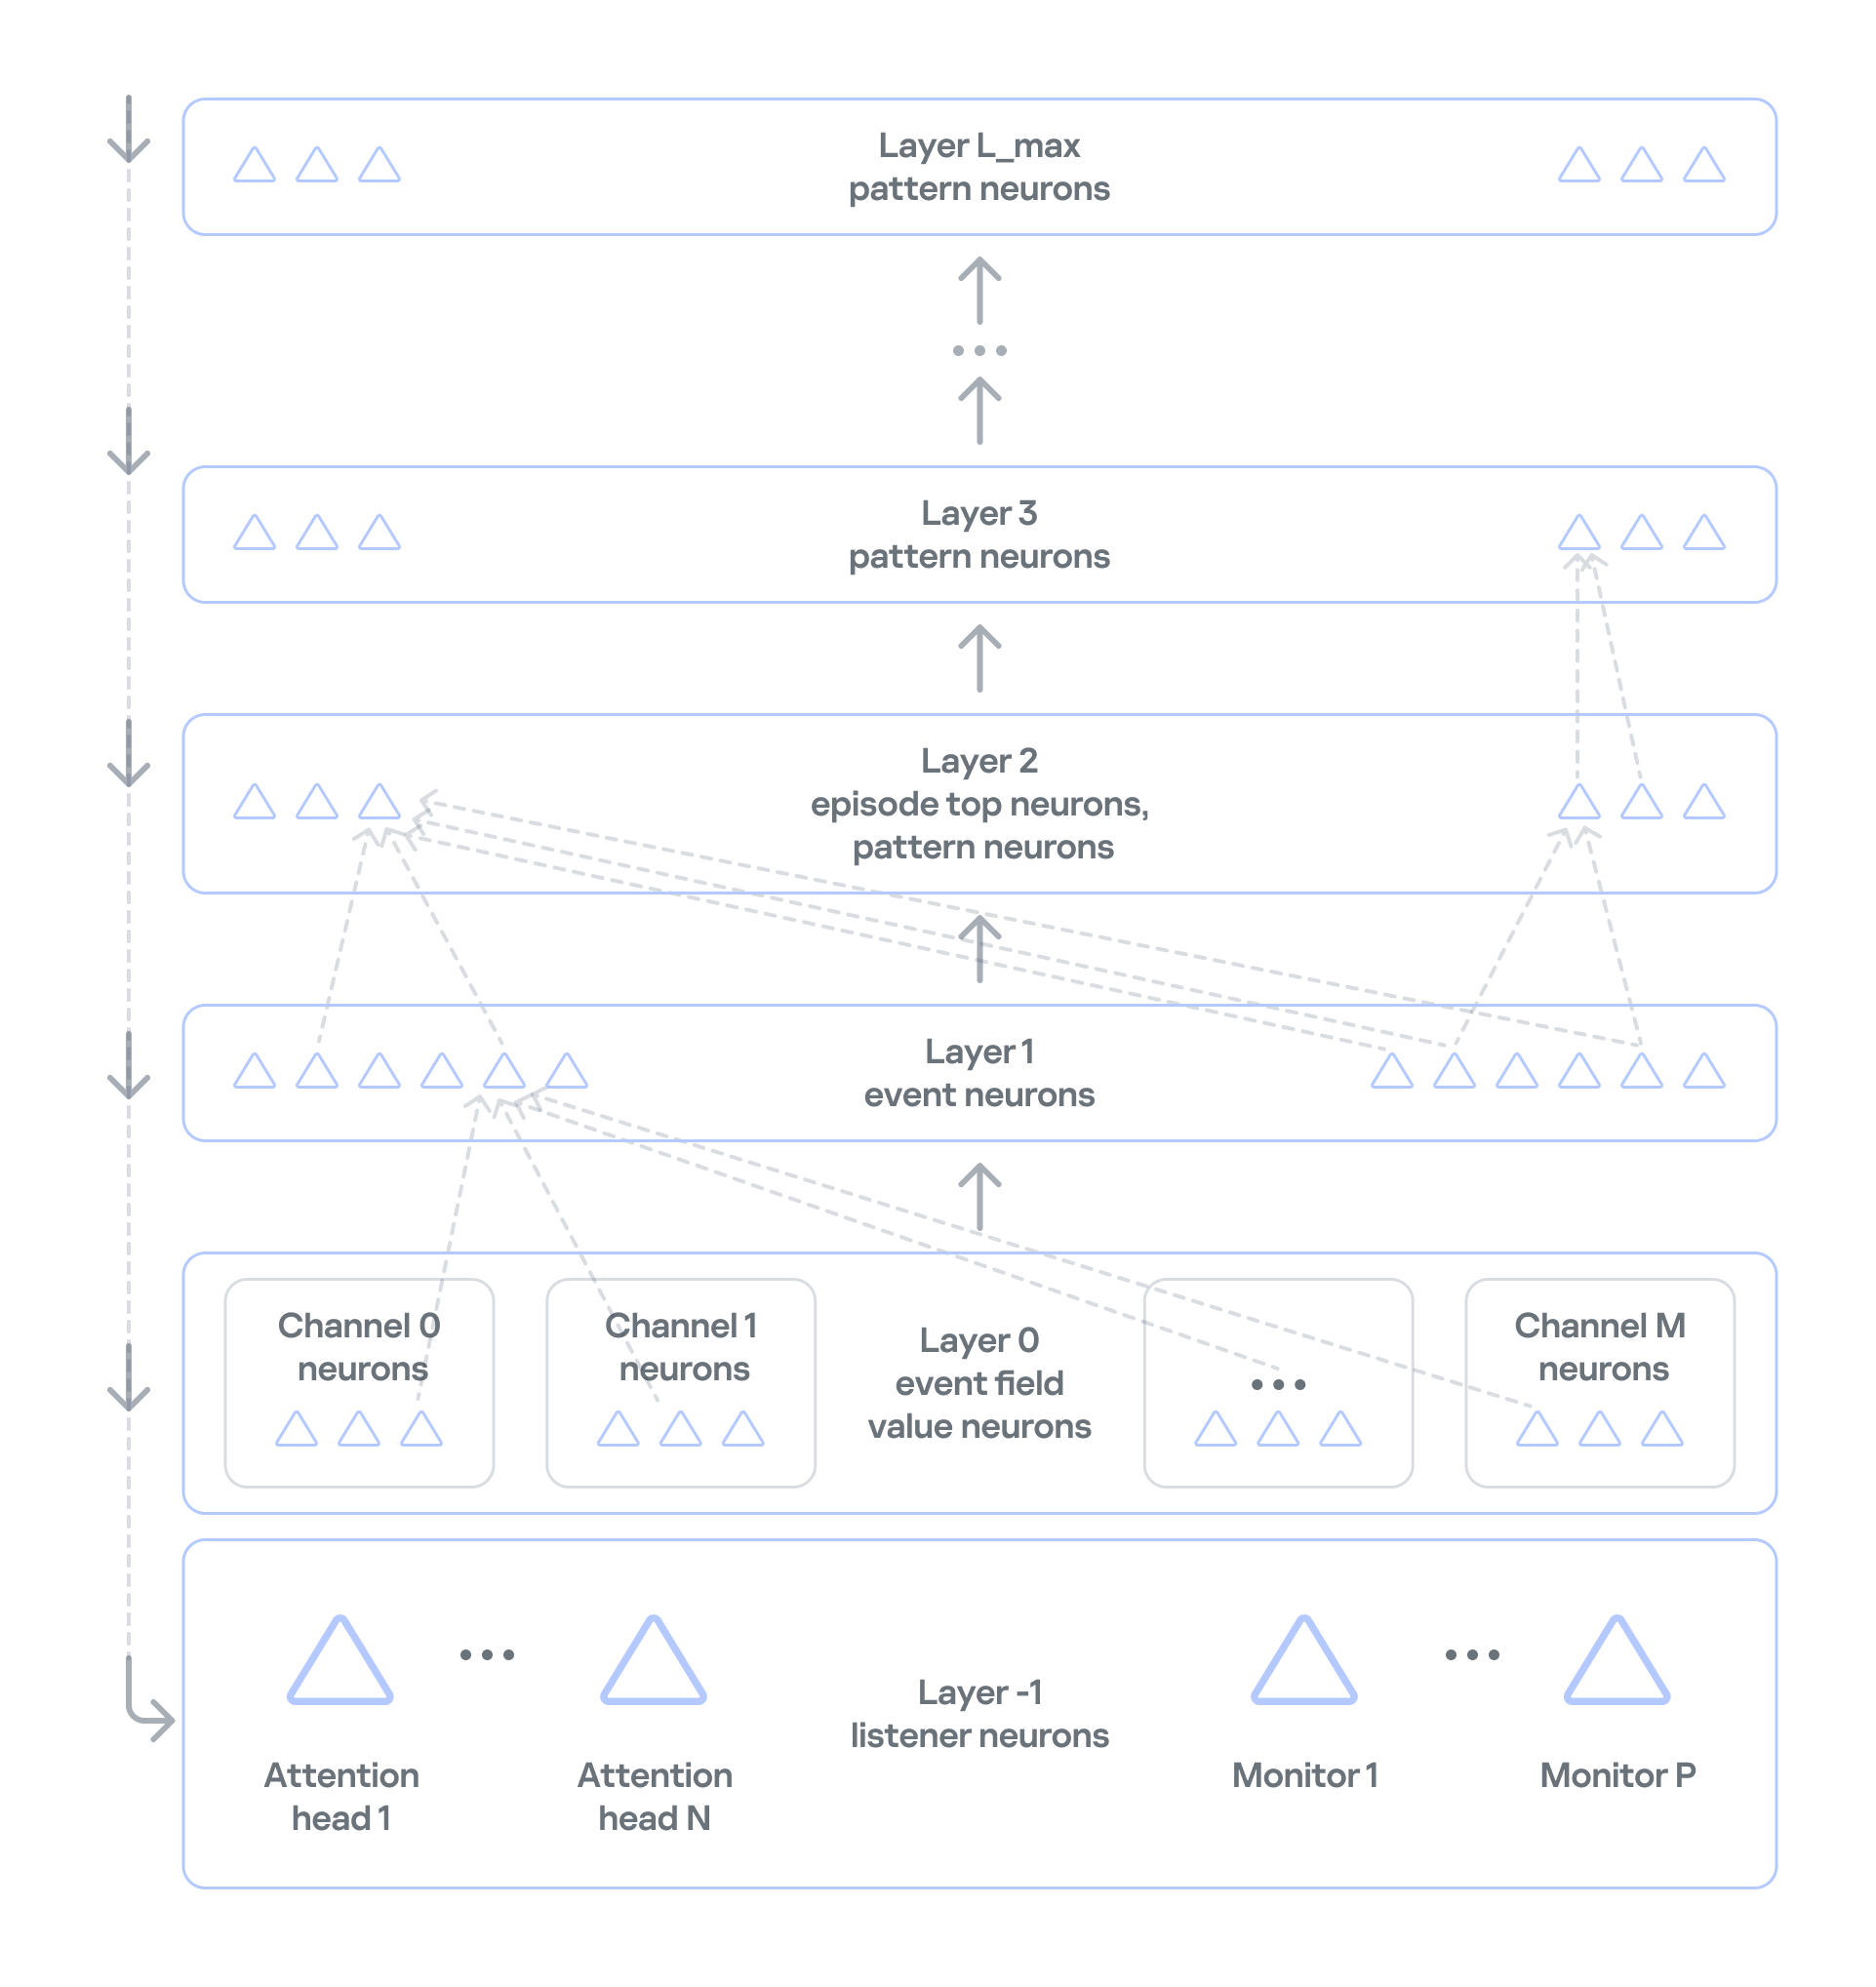
    Event history

    In NSN-based event processing, layer 2 and above store sequences of events over time: recurring patterns and the full history. However, categorization and statistical anomaly detection don’t require storing the full packet sequence or a detailed timeline of every network event. As we noted earlier, events are themselves aggregates, which means the order of network packets has already been averaged out. So MLEP keeps history only temporarily, within each episode (30,000 aggregated events by default), which saves computing resources.

    Statistics processing in MLEP

    MLEP processes statistics mainly through specialized listener neurons on layer −1 (minus one) of the network. Attention heads and monitors are built on these neurons.
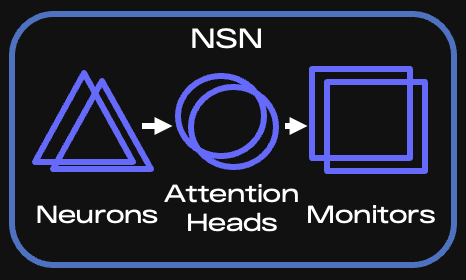
    Key components of the NSN

    Key components of the NSN

    When an event arrives, the corresponding neuron is activated, and the network instantly knows whether that neuron is new or was created earlier. Each attention head subscribes to the events or event features it needs and takes in only the activations of the matching neurons. If an event occurs for the first time, all heads are notified and then decide whether to subscribe (grow a connection to the relevant neuron) and receive information about activations of such neurons from then on.

    It is called a spiking network because activation information is a spike, not a number. This spike tells the head that something it’s interested in has happened.

    An attention head is configured according to scenarios — the situations that MLEP should send alerts about. The core of a head’s configuration is a query, which filters incoming information and serves as the subscription criterion. Unlike regular database queries, this query runs on the stream, so it can react to an event instantly.

    Attention heads work very much like the semantics of ordinary human language. A query has a subject of attention (one or more grammatical subjects) and conditions (the other parts of the sentence). In the infrastructure of an industrial enterprise, the subjects are devices on the network, and the conditions are various aspects of network communication, such as ports, protocol, and average packet size. If a head has many subjects (for example, if it’s interested in every device on an industrial network), it fans out: it creates a child head for each individual value of the subject of attention, that is, each device. The child head then watches a specific device and reports to the parent head.

    Attention heads don’t accumulate or process statistics. They only filter event streams. When an attention head receives a relevant event, it activates and sends a spike to the monitor subscribed to that head.

    Monitors, in turn, have stacks for accumulating and processing events. They can also have their own queries and post-filter information from the head. For example, they can select only new events from those filtered by the head.

    There are several types of monitors:

    • Stat monitors track changes in the average count of specific events (for example, device activity) over time intervals typical for those events, or in the average values of numeric event parameters (for example, changes in device traffic volume).
    • Monitors work from the event alone: they fire when an event has occurred a certain number of times within a given interval, or has occurred for the first time.
    • Similar-behavior monitors work with heads that can generalize events, that is, extract just a few parameters whose combination is shared (generalized) across many events.

    MLEP uses these monitor types to implement scenarios for categorizing devices and detecting their anomalous behavior:

    1. For categorization, MLEP uses attention heads and monitors that identify common behavior across different assets and group devices accordingly. MLEP then takes information from Asset Discovery about the known categories of some assets and extends those categories to other assets in the same group. Because a device can show different types of activity, it may land in several groups. MLEP then makes a weighted assessment across all relevant groups.
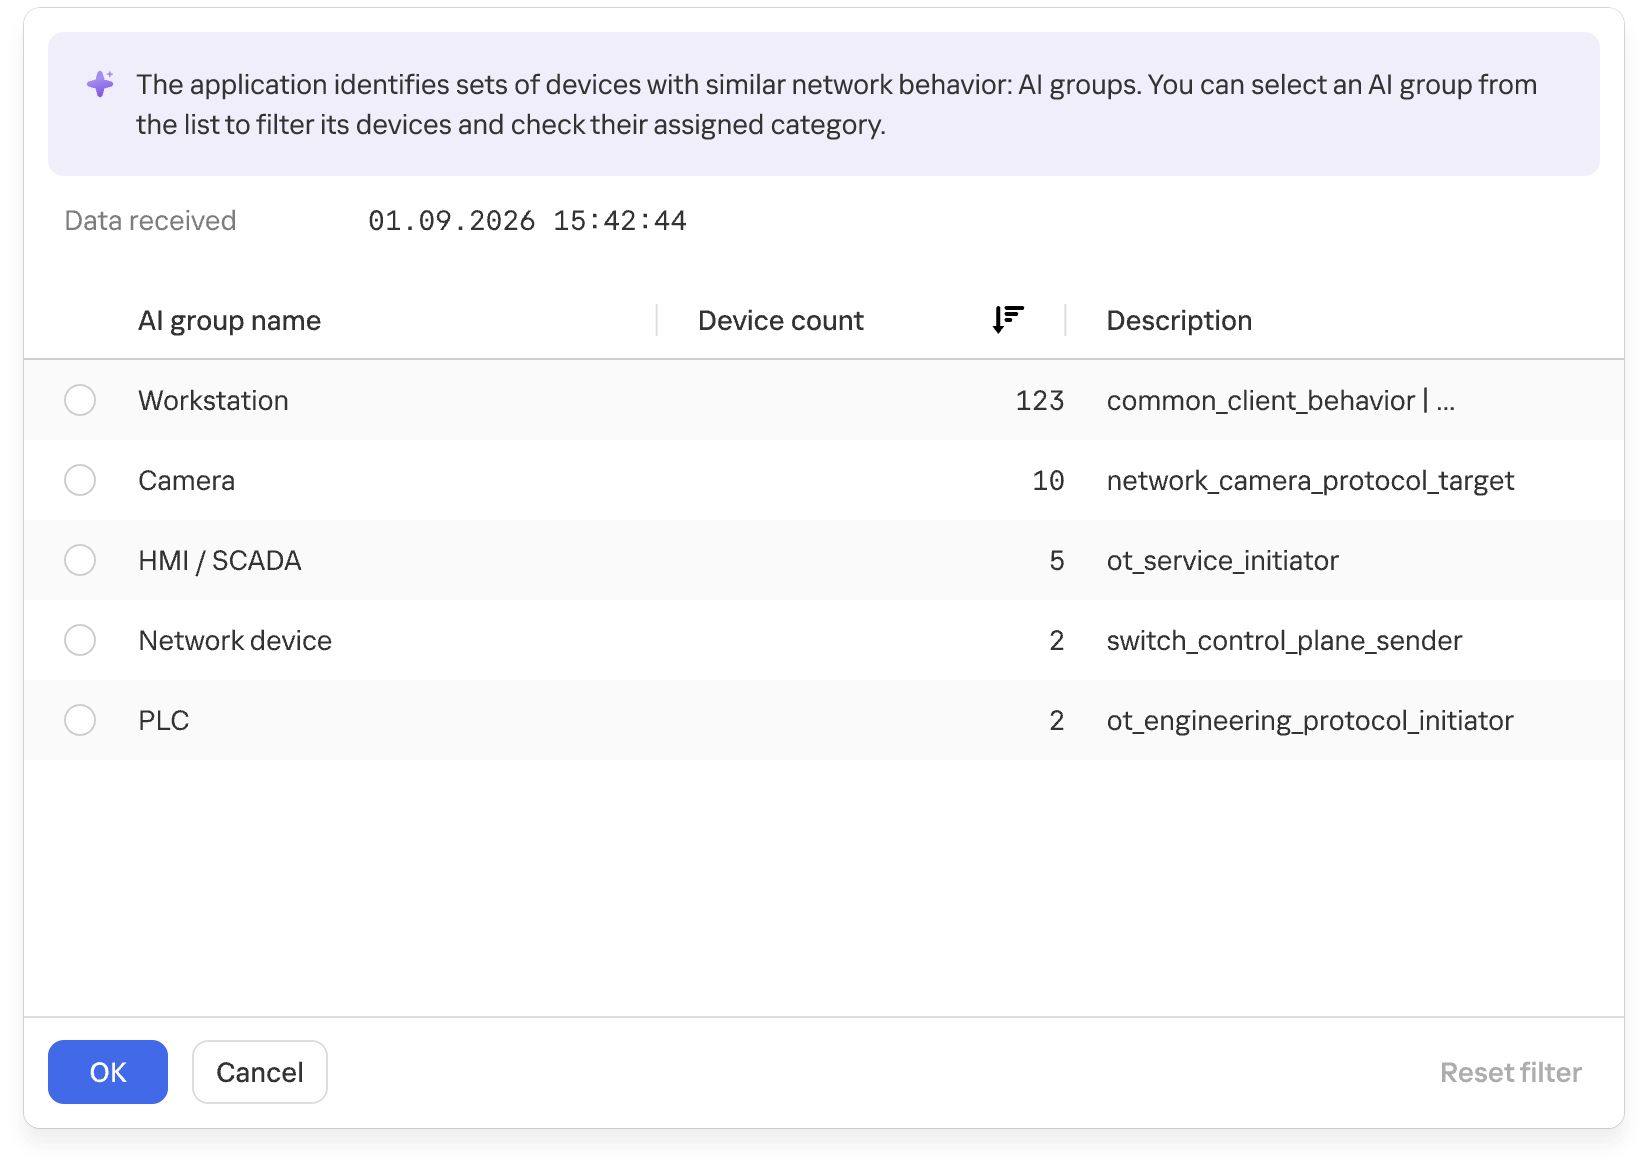
      Groups of devices with similar network behavior

      Groups of devices with similar network behavior

      At the final stage, the system verifies that assigning the category to the asset is permissible. This is again done by special rule monitors loaded into the NSN at system startup. The rules rely on asset metadata available from Asset Discovery and APMs.

    2. MLEP takes a similar approach to anomaly detection: an attention head and a monitor define an anomaly scenario, often loosely. When a monitor activates on such a scenario, MLEP generates an alert about unusual behavior.
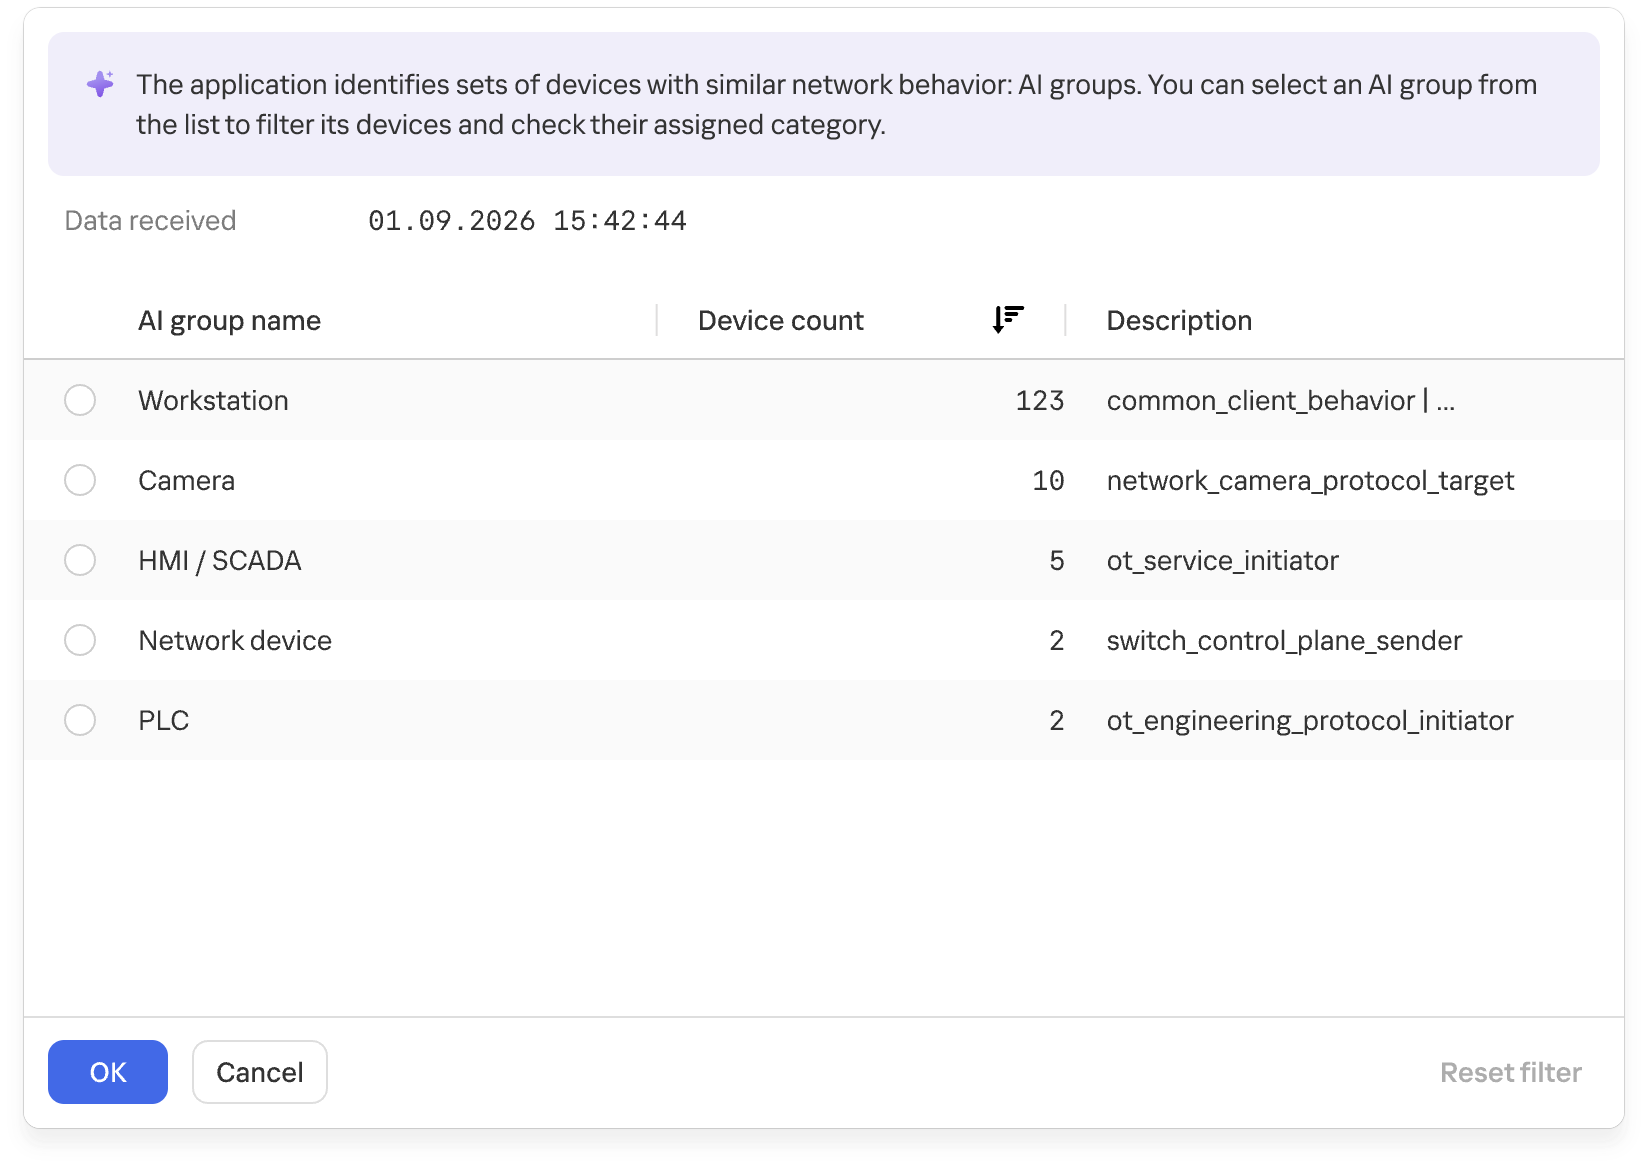
    The current version of MLEP ships with preconfigured heads and monitors.

    The functional dynamic diagram below shows how events from devices on an industrial network are processed.
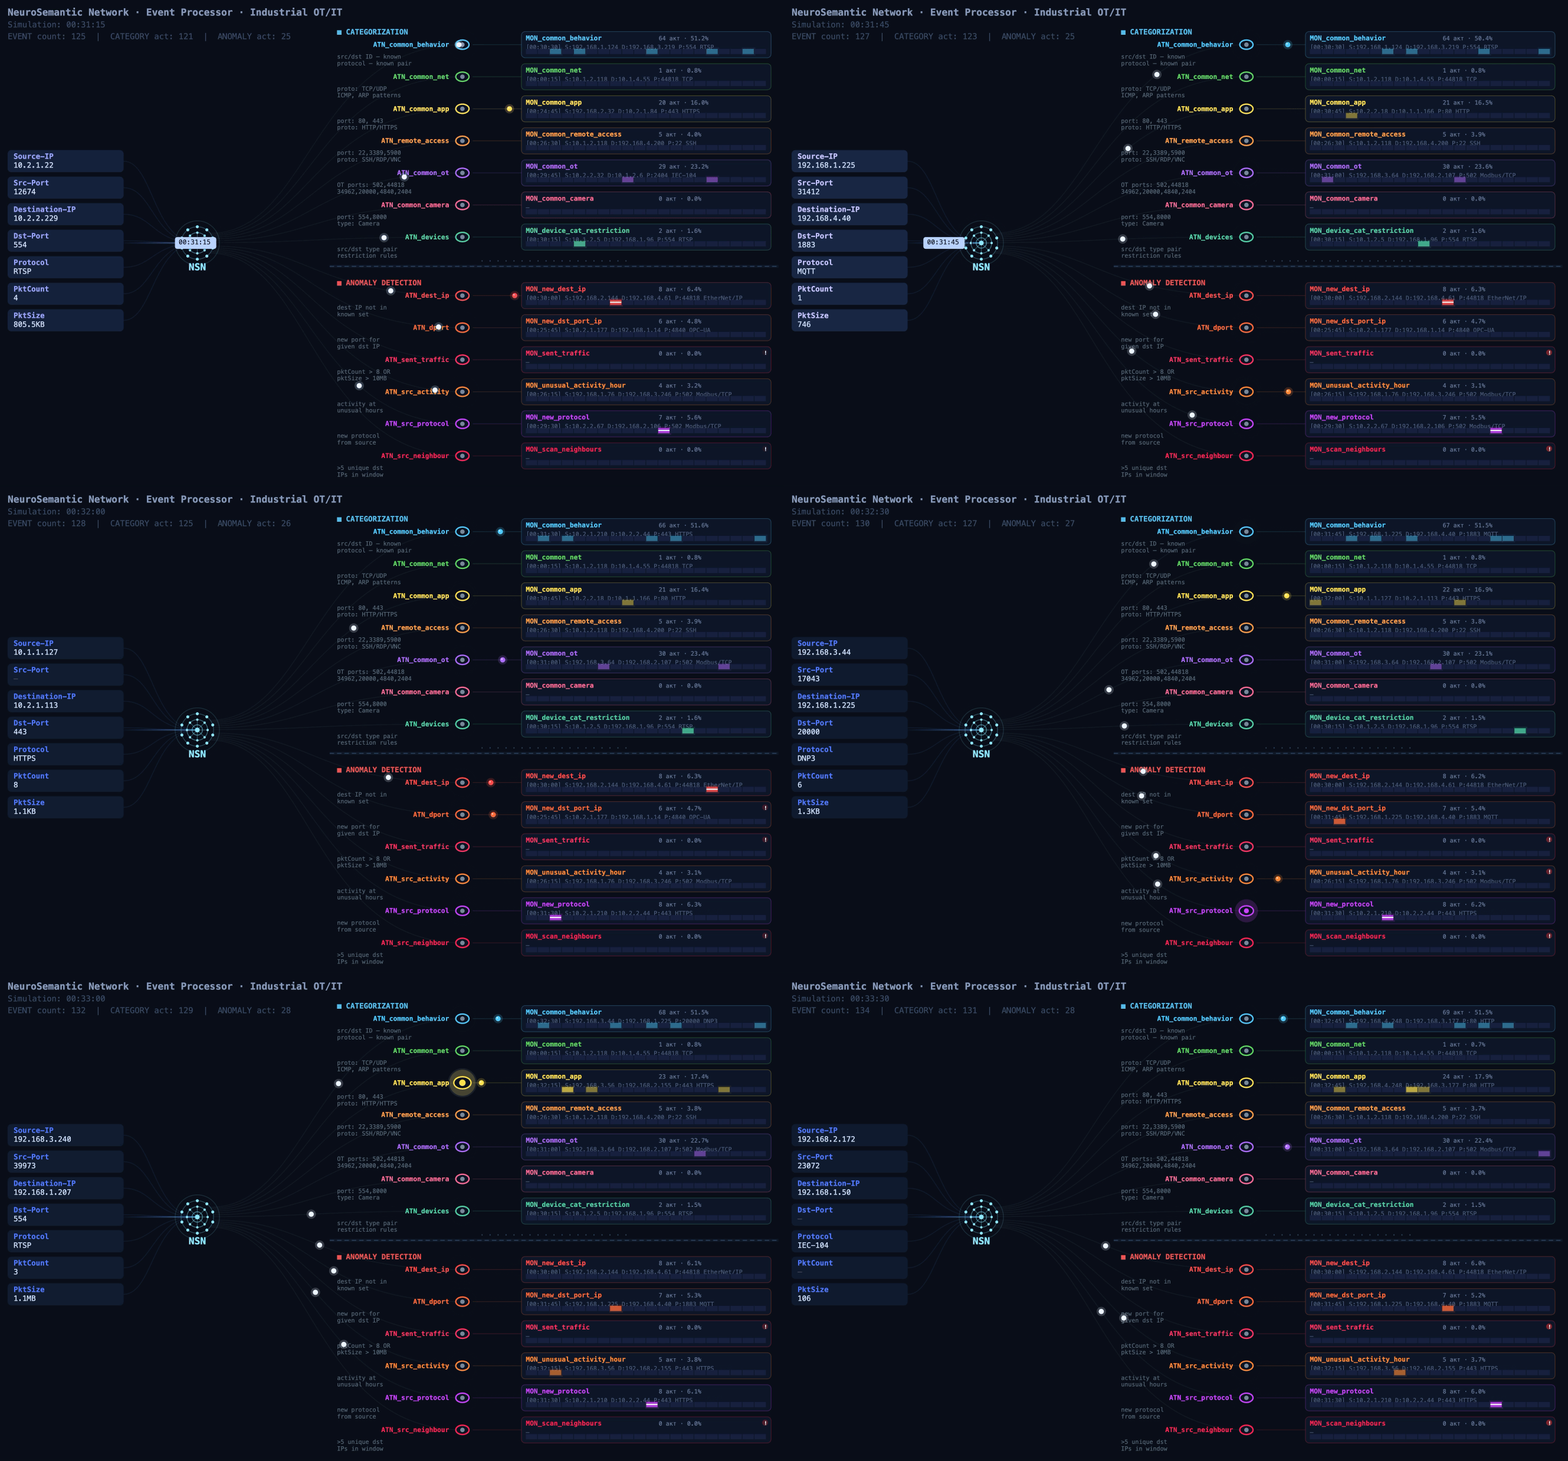
    Event processing flow

    Event processing flow

    MLEP in practice: how behavior helps complete the asset inventory

    At a facility with several similar production lines, device information may be more complete on some lines than on others. On one line, devices are identified as PLCs, while on another, after an upgrade, some hosts show up only as addresses: the available traffic didn’t provide enough information to determine their category. Still, these devices communicate with the same types of HMIs and process data collection servers. Their communication directions, frequency, and volumes may be similar.

    That’s where MLEP comes in. It takes the categories of already known assets and matches recurring features of their network behavior against those of uncategorized devices. When the observed interactions turn out to be similar, MLEP can add a category for that host to the inventory.
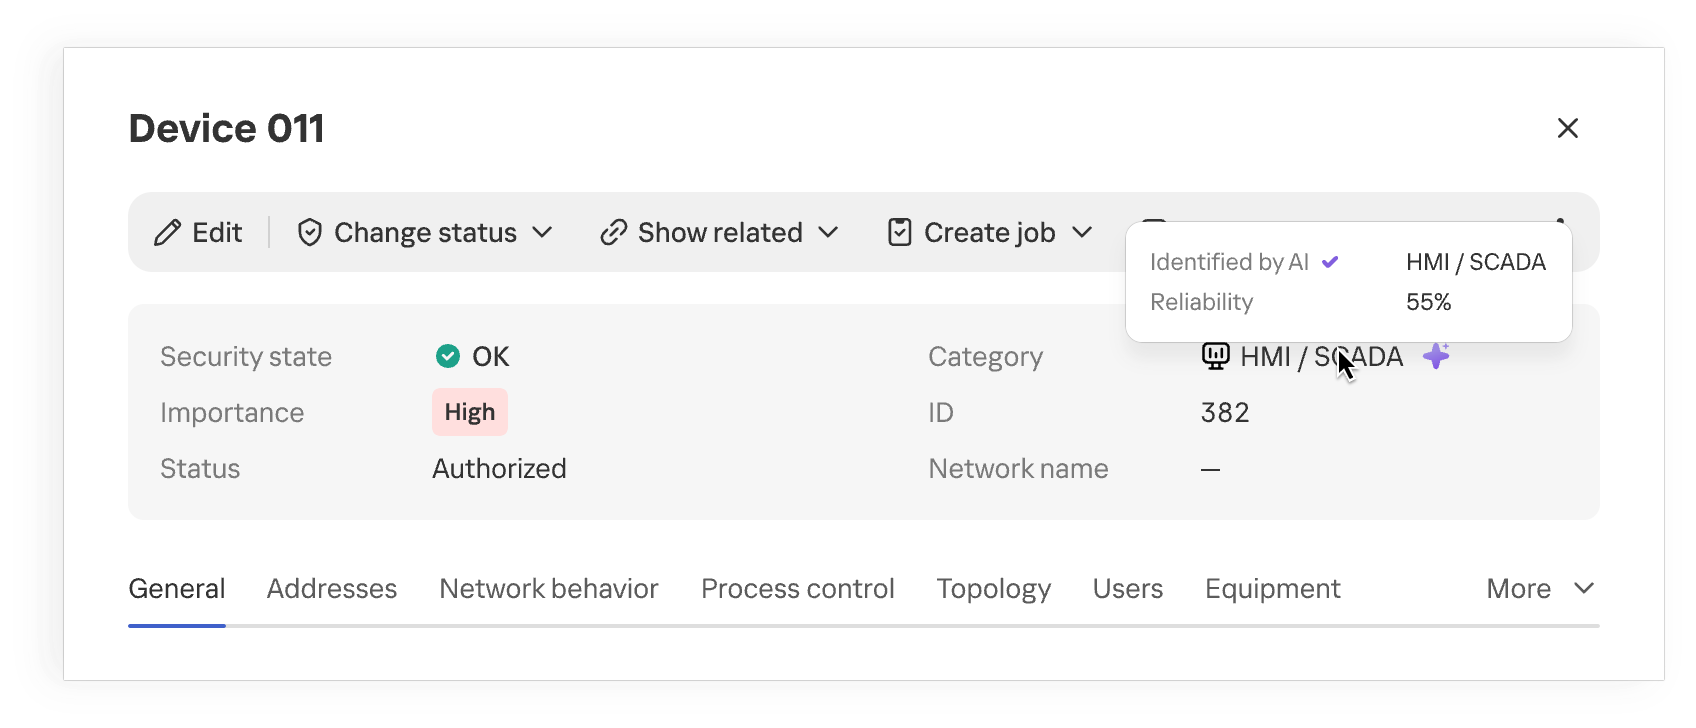
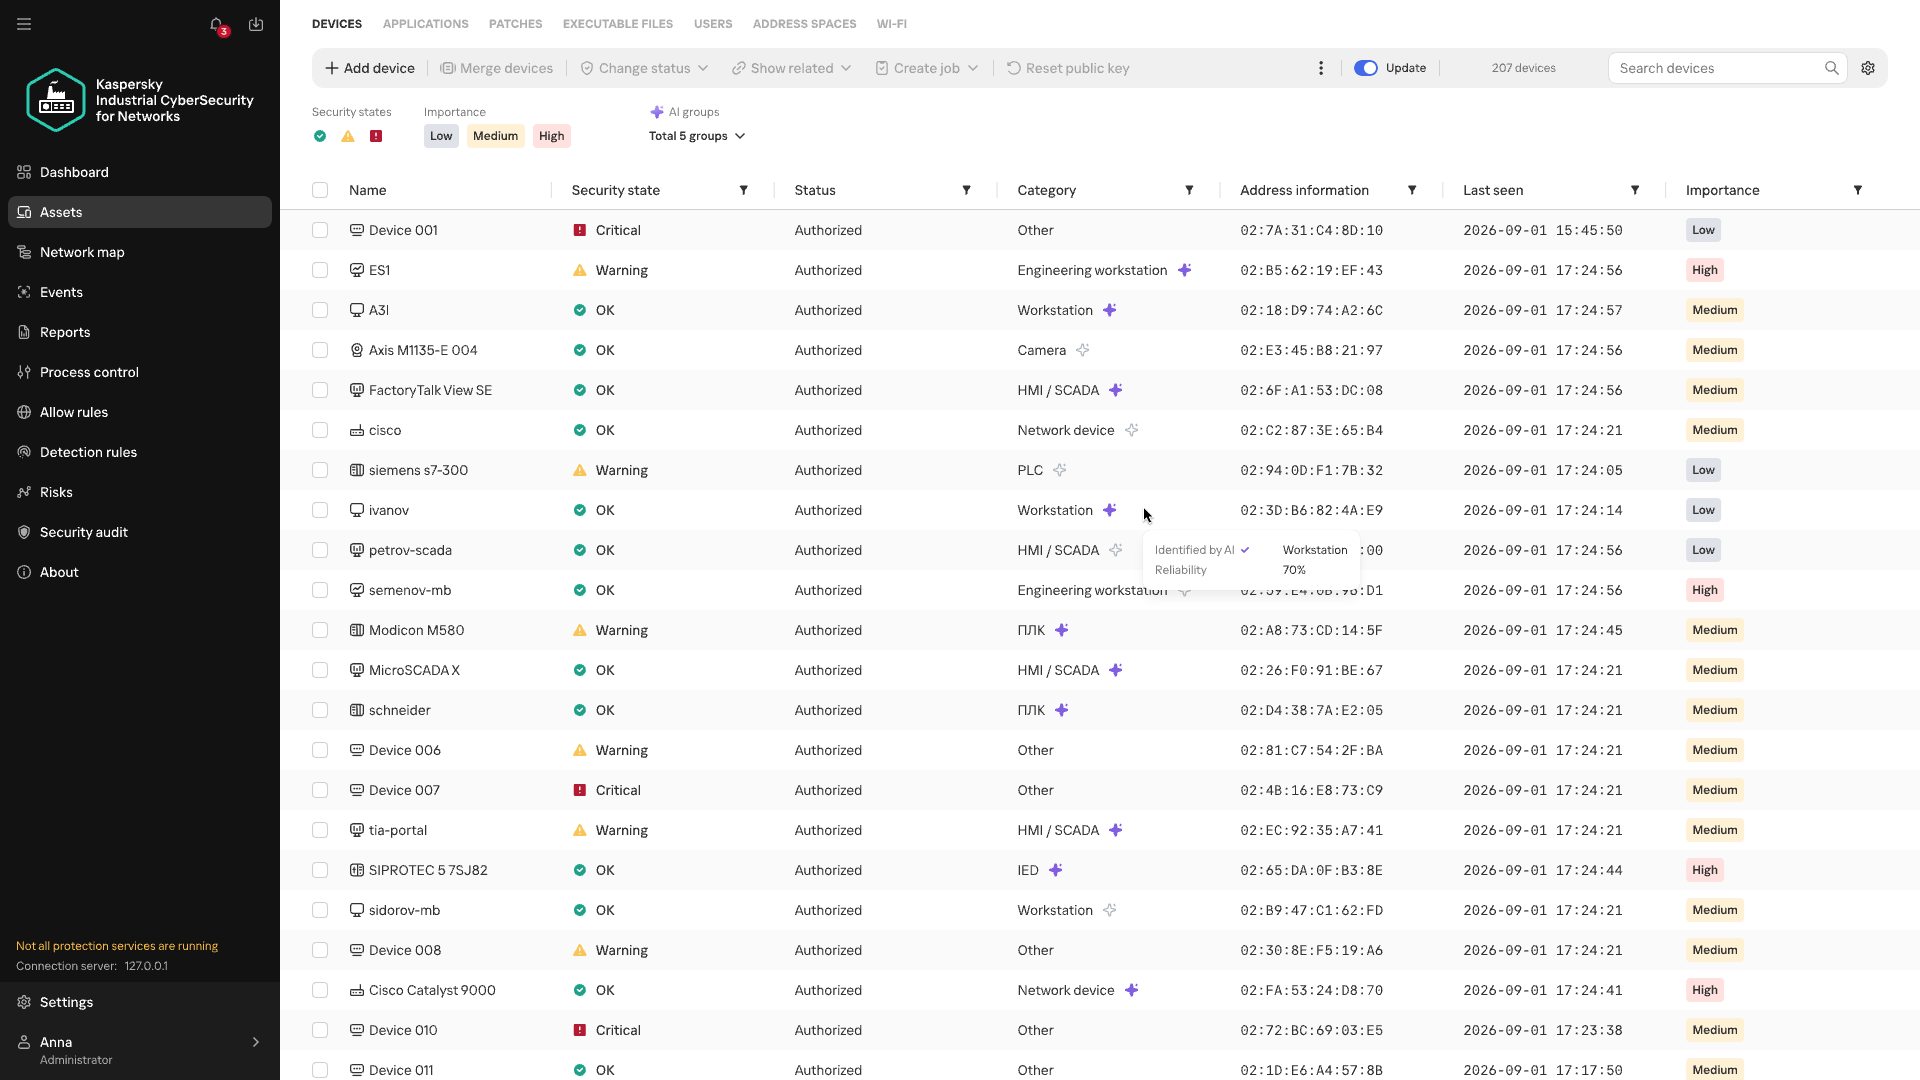
    Device category suggested by MLEP

    Device category suggested by MLEP

    Once the category is refined, the industrial network map provides more context about the equipment on the network. When analyzing network activity, the analyst immediately sees the device’s suggested category and can skip looking up each IP address in the design diagrams. This approach is especially useful where equipment changes faster than the documentation is updated.

    The suggested category is also checked against existing device information and defined constraints. This helps filter out some contradictory options, but prediction quality still depends on how much of the traffic is visible, especially if the device communicates only rarely.
    Anomalous activity and streaming statistics

    Investigations of real-world attacks show that attackers actively use both standard tools and permitted protocols. You don’t always need to know an attacker’s specific technique in advance to spot potentially malicious activity. Signature-based detection helps find known signs of an attack, but it doesn’t assess how typical an observed interaction is for a particular device. MLEP compares current activity with the device’s usual network profile: which hosts it communicates with, which protocols it uses, when and how much data it transmits, its average packet size, and so on. The changes it detects help guide the direction of the investigation. Correlating these changes with other events and the operational context helps determine whether malicious actions could be behind them. When investigating an incident that has already been detected, anomalies help reconstruct the sequence of actions.

    The first version of MLEP comes with six preconfigured monitors, one for each type of deviation from the device’s usual network profile:

    Anomaly How it helps with event analysis
    New external host Flags a new external connection that wasn’t previously seen in the device’s observed behavior, even if the IP address isn’t listed among known IoCs. Helps check whether this connection appeared at the same time as other suspicious events.
    New combination of destination address and port Shows that the device has begun using a service it hasn’t used before. Once an incident has been detected, this helps trace new connections after the more critical events have been analyzed.
    Unusually large volume of data sent Highlights data transfers that are atypical for the device and helps correlate their timing and direction with other events.
    Atypical activity time Shows that the device was active at a time that’s unusual for it. In an already detected incident, this helps reconstruct the timeline of actions around the main alert.
    New protocol Helps spot a new method of communication, even when the device is communicating with familiar hosts.
    Activity with signs of scanning Shows that the device has started contacting an unusually large number of neighboring hosts. This signal helps reveal possible reconnaissance ahead of attempts to access equipment.

    During an investigation, anomalies help reconstruct the sequence of changes: when a specific host established new connections, switched protocols, increased its data transfer volume, or shifted its operating hours. Matching events by device and time shows an analyst how activity unfolded around an incident that has already been detected.

    This is especially useful when some of the attacker’s actions fell outside the monitored scope or didn’t trigger other KICS technologies. Correlating these changes with the device’s role, protocol analysis data, and events from other technologies gives the analyst a more complete timeline. Behavioral anomalies show exactly where to look for the missing links and which network interactions need attention.
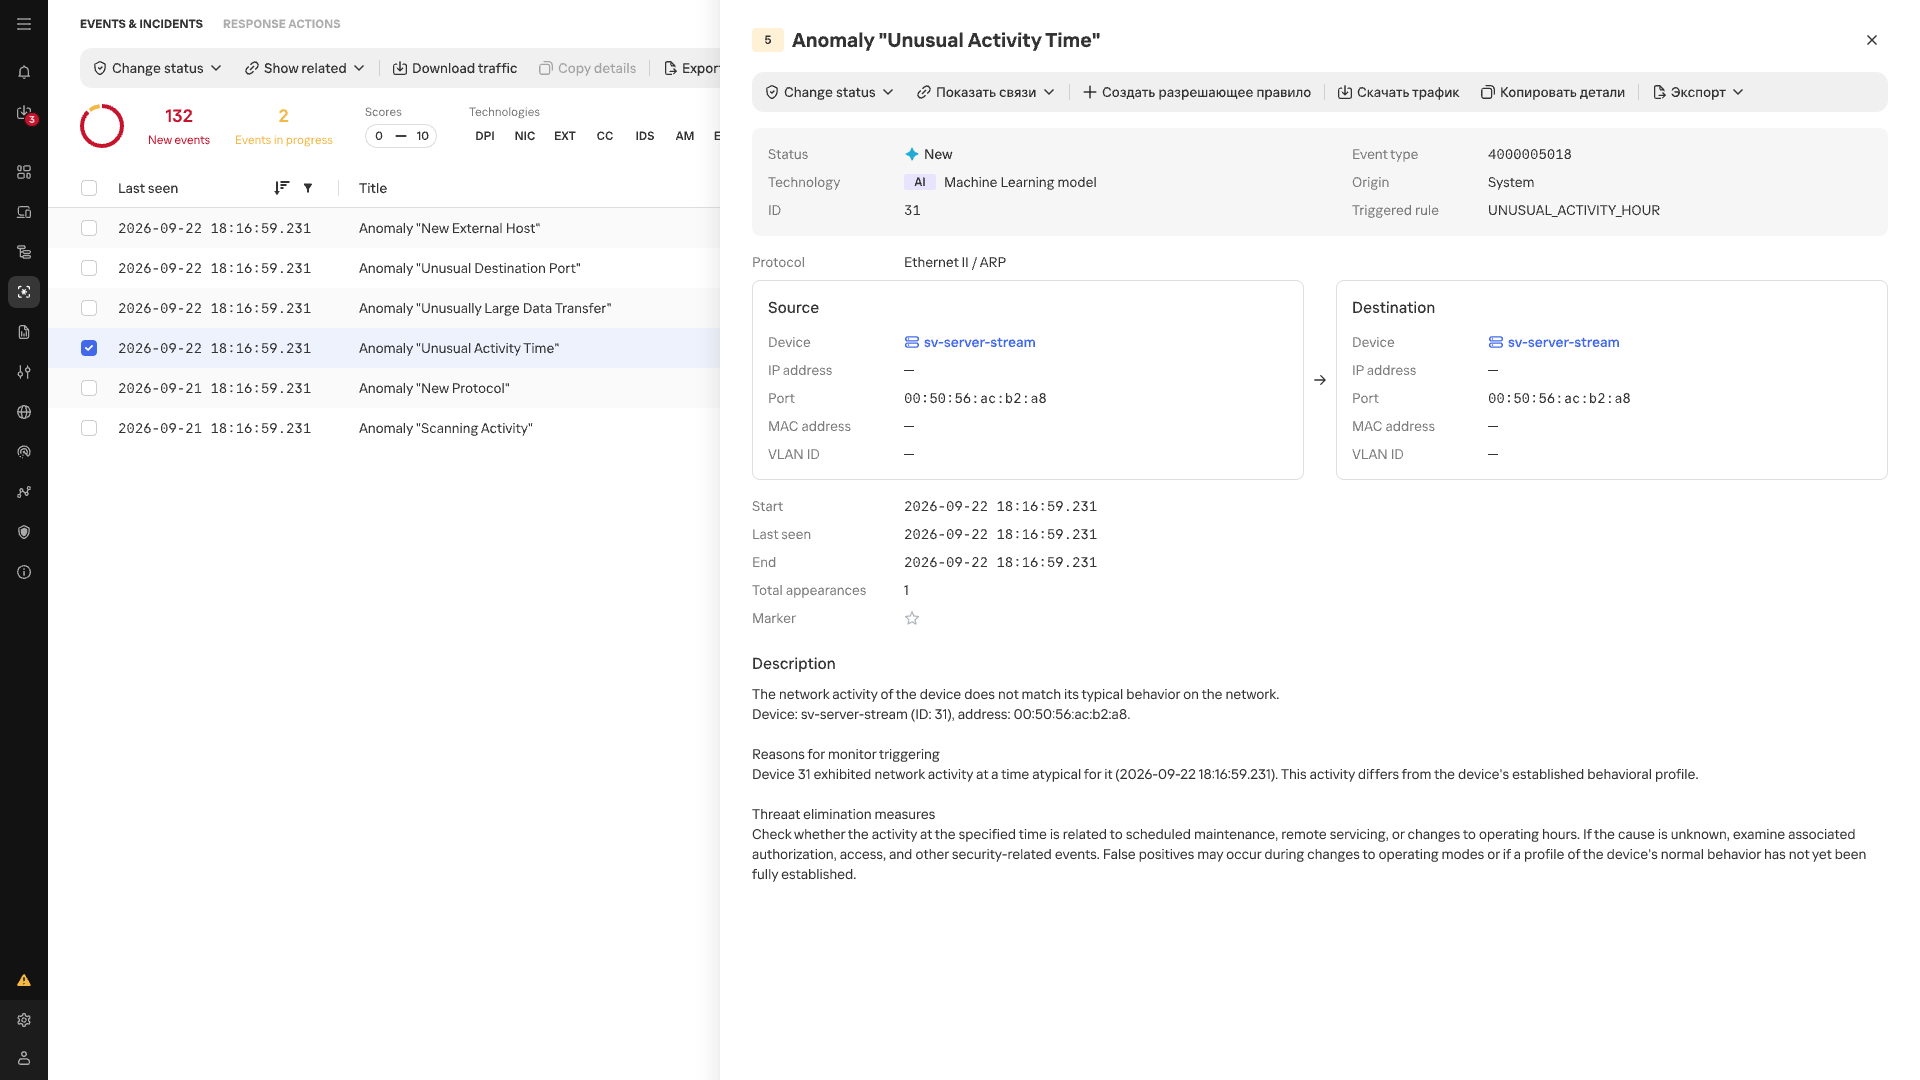
    Atypical Activity Time anomaly card

    Atypical Activity Time anomaly card

    In the event list, anomalies detected by MLEP are marked with an AI label. Each event shows its name, source, destination, timestamp, and the ID of the triggered scenario.

    Conclusion

    In an industrial network, whether behavior is anomalous depends on the host where it occurs and that host’s place in the industrial process. The repetitive nature of many communications makes a change in normal data exchange easier to spot, while knowing a device’s function and criticality helps gauge the possible consequences. Taken together, these observations make network traffic more than a list of connections: it helps assess new events in the context of a specific facility, even without an attack scenario known in advance. Machine learning technologies are well suited to this kind of comprehensive analysis, as they can process and organize huge streams of heterogeneous data. Starting with version 5.0, Kaspersky Industrial CyberSecurity for Networks handles this function with MLEP, which works effectively alongside the product’s existing functionality.

    Source: Securelist (Kaspersky GReAT) · 2026-11-03

  • The journey of a paper unicorn: adventures inside a modern warehouse

    The journey of a paper unicorn: adventures inside a modern warehouse

    Introduction

    Imagine you’ve ordered a small paper unicorn from an online marketplace. You clicked “Buy”, received a cheerful notification, and expect a courier to bring the box tomorrow. If the unicorn is delayed by a day, it will be annoying but not catastrophic: an apology, a discount promo code — and the incident is forgotten.

    Now let’s multiply one late unicorn by several hundred thousand orders.

    Packages start heading to the wrong cities. The website shows an item is in stock, even though the required bin is empty. Conveyors stop, boxes get stuck between floors, the cargo piles up with no freight manifest. Trucks line up at the gates, and every minute of downtime turns into blown schedules, support tickets, fines, and lost sales.

    It is at exactly this scale that a cyberincident in a warehouse becomes a problem for the entire business. A modern warehouse is no longer just a big building with shelving. It is a tightly interconnected hybrid system: web applications, radio channels, and an automated factory. Physical processes here depend on data, and errors in data have very physical consequences. Examples include an outage that affected warehouse management systems at the grocery giant Morrisons, and the 2025 Form 10-K annual report of United Natural Foods, Inc. (UNFI), which confirmed unauthorized activity on information technology systems that impacted order fulfillment. More recently, reports emerged that a cyberattack disrupted eight CEVA Logistics warehouses across Europe and exposed customer delivery data.

    This paper follows a single order through a warehouse to show where the operation is vulnerable, the stages it traverses, the systems that drive it, and the points where an attacker can reach them. We then set out the threat model: what is at risk, who is in a position to take it, and how each risk lands on the business. From there, we look at how an attacker gets in, and what reaching the warehouse management system costs in practical terms: orders unshipped, inventory records nobody can trust, and an operation that stops. We close with recommendations on where the controls that matter actually sit.

    Tracing the unicorn

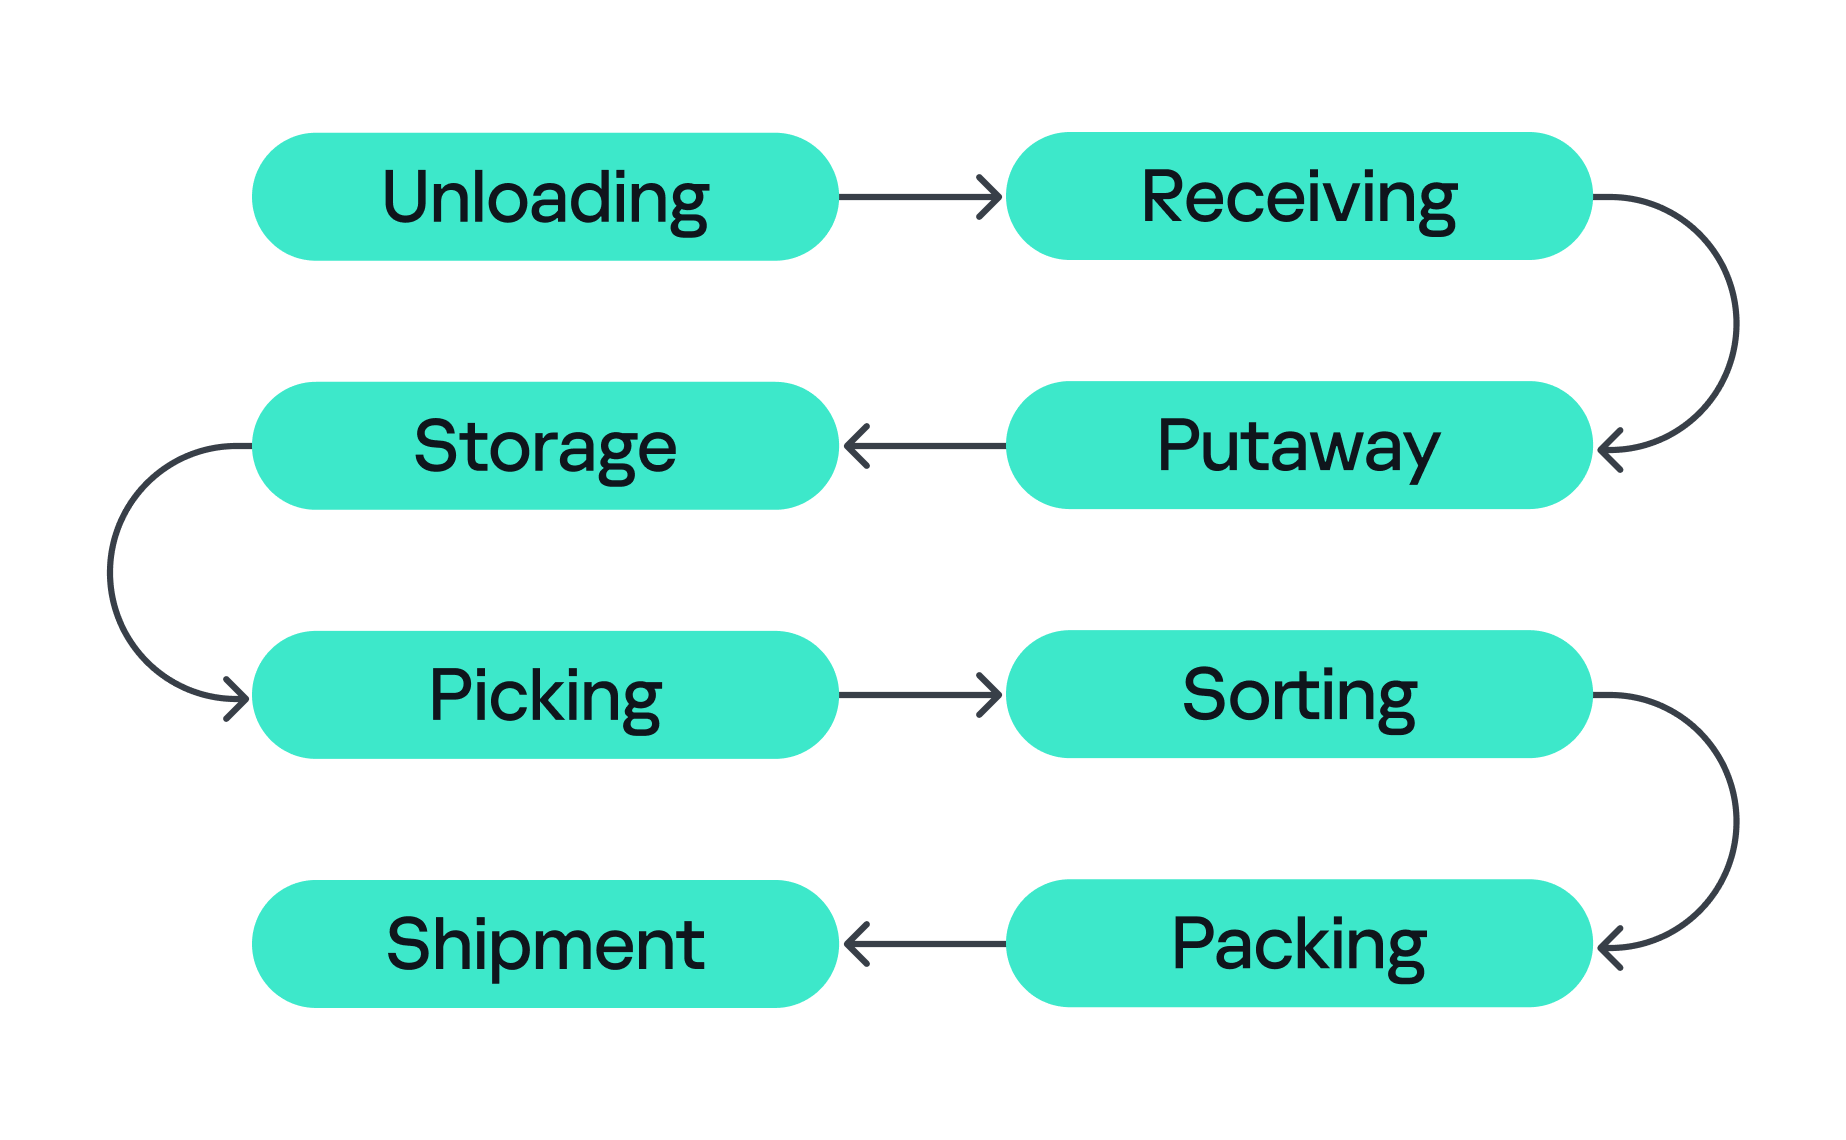
    A modern warehouse is a sequence of stages involving many machines and people, all working together to keep the business process stable so that, in the end, your order gets delivered. This process consists of eight main stages, shown in the figure below.

    Stages of order fulfillment

    Stages of order fulfillment

    So let’s assume we’ve ordered our paper unicorn and are waiting for it at home. Let’s follow our order through all the main stages, from its arrival at the warehouse to the final stop on its journey.

    1. Unloading
      First, the unicorn arrives in the unloading zone, packed in a big truck. The driver is assigned a gate, for example, via a tablet with kiosk mode enabled, or an outdoor display board, indicating where the truck should park and where the cargo will be unloaded. Even at this very first step, a digital command (the gate number on the screen) is already triggering a physical action. Therefore, incorrectly assigned gates can create a queue, delay unloading, or send goods into the wrong workflow.
    2. Receiving
      At this stage, employees identify the cargo. They scan a barcode using a portable data terminal (PDT) and the central system receives a message indicating that this object arrives at the warehouse. From this moment, the unicorn exists in two forms at once: as a real box and as a record in the information system. If these two versions diverge, the error is inherited by all subsequent processes.
    3. Putaway
      Next, the goods are moved into internal storage. Two new devices come into play here. First, a thermal printer, connected to the internal network over Wi-Fi, creates an internal label for each item. Then an employee, forklift, or automated system moves the goods to the assigned bin, often with the help of lifts controlled by PLCs. Both of these devices can be valuable attack entry points: one can let an adversary pivot into the internal network, while the other can give them control over an electric motor.
    4. Storage
      Then the unicorn goes into storage. Many distribution centers use multi-level mezzanine structures: several floors of metal shelving inside a huge space. They allow efficient use of the building’s height, but at the same time complicate control over the technical infrastructure. Wi-Fi access points, cameras, switches, cables, and sensors may be mounted high overhead or buried deep inside the rows. A forgotten Ethernet cable or misconfigured networked device (access point or switch) left behind in a dark corner can become a convenient initial access point into critical infrastructure.
    5. Picking
      When the customer places an order, picking begins if the goods were already stored in the warehouse or as soon as they are unloaded. A PDT, workstation, light indicator, or voice terminal directs the employee to the required bin where they pick the goods and move them to the next stage. These devices are themselves potential attack entry points: compromising a workstation or PDT could allow an attacker to manipulate picking information, which could misdirect employees to the wrong bin. Here, both the speed and integrity of the information are critical, and any manipulation or disruption can lead to wrong orders, delays, or problems in subsequent stages.
    6. Sorting
      At the sorting stage, the warehouse starts to look more like a factory. Boxes move through conveyor belts and pass through different scanners, diverters, and chutes. The sorting plans are usually stored and managed by dedicated servers, while PLCs are responsible for controlling the machinery and executing these plans. For example, when the warehouse management system (WMS) decides that our unicorn should take route A, the control system needs to activate the right diverter at the right moment, sometimes within a fraction of a second.
    7. Packing
      During packing, an employee or a robotic arm places the goods into the final box, prints the shipping label, and sometimes measures the dimensions and weight of the package. Safety mechanisms usually prevent robotic arms from leaving the controlled zone and harming nearby operators, but their compromise might inflict physical damage on the packages being processed.
    8. Shipment
      Finally, at the shipping stage, the parcel heads to the gates. Automated guided vehicles (AGVs) and autonomous mobile robots (AMRs) move containers and pallets across the warehouse, while the dock management system coordinates the truck that will carry the unicorn onward to a store, a sorting center, or straight to the customer. These robots are themselves a potential target for attackers. Attacks can be conducted against AGVs and AMRs to interfere with their operation, for example by affecting their navigation or preventing them from reaching their intended destination.

    All eight stages are coordinated by the WMS. It looks like a large web application, but in its role it’s closer to the operating system of the entire warehouse: it knows which goods exist, where they’re located, who or what should move them, and where they go next, linking employees, inventory levels, storage addresses, tasks, and orders. It also exchanges data externally: with ERP systems, transport platforms, marketplaces, dark stores, and external carriers.

    Surrounding the WMS is an even larger digital ecosystem: identity services, databases, APIs, printers, carrier systems, technicians’ laptops, video surveillance, access control, fire and gas alarms, power supply, and a building management system (BMS).

    That is why a single “warehouse network” doesn’t really exist. As we’ve seen, there are many overlapping technologies — IT infrastructure, OT systems, radio, cloud services, building security, and automation — layered on top of one another. A lone vulnerability scanner will never tell you whether a warehouse is secure.

    Hunting the unicorn

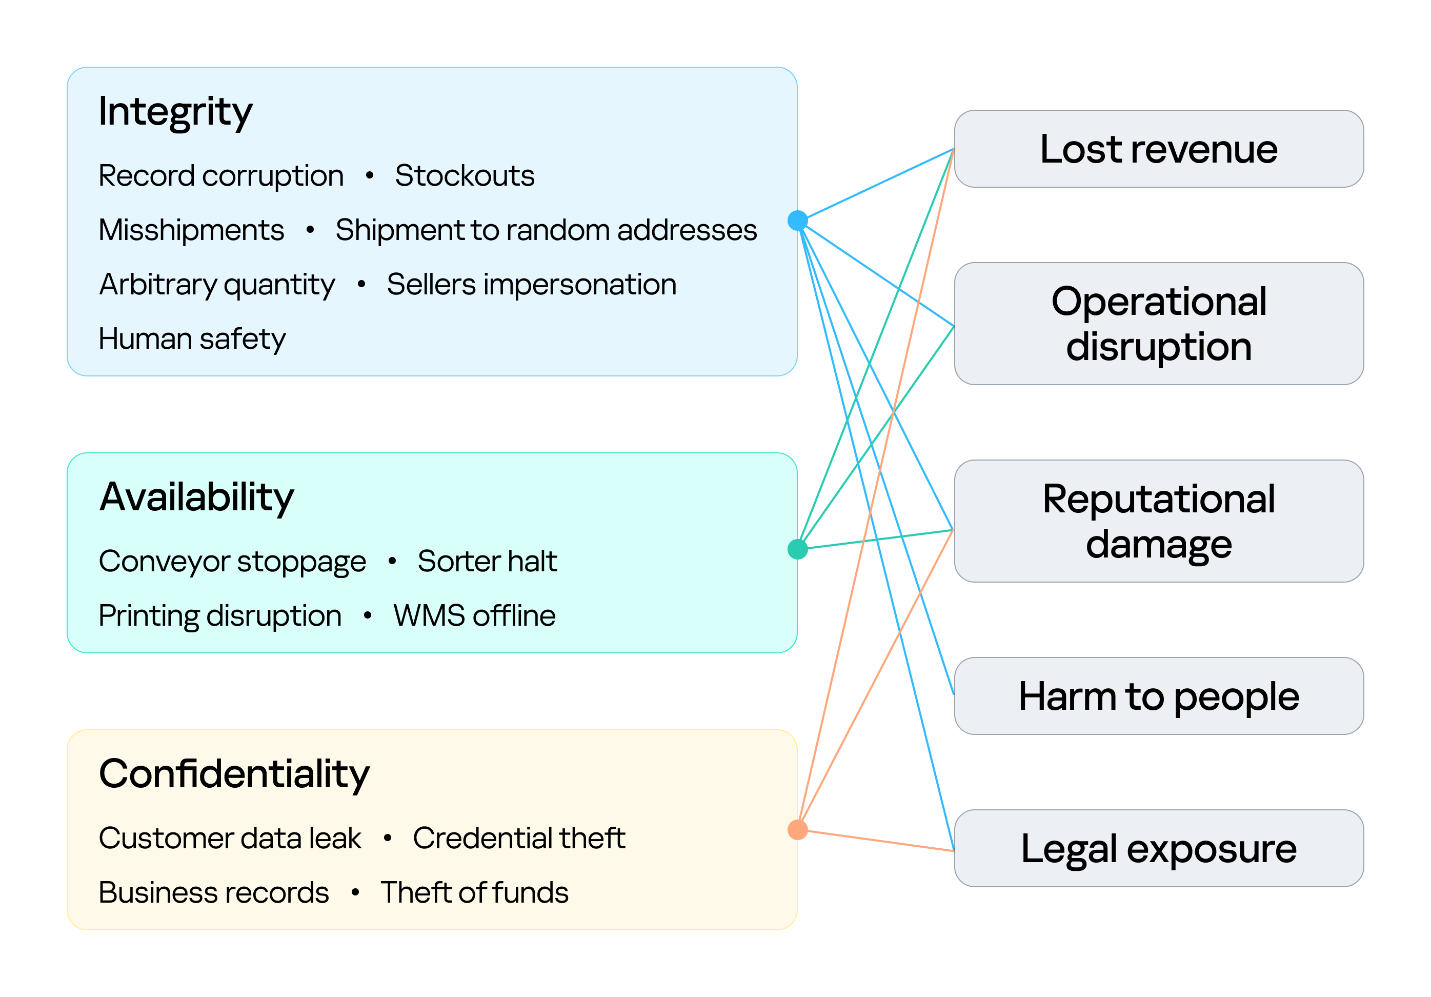
    Securing an environment such as a warehouse requires a comprehensive security assessment covering all of its interconnected systems. This involves identifying vulnerabilities across each system and understanding how weaknesses can be combined into attack paths that a real attacker could exploit. But a vulnerability only matters in proportion to what it exposes and who is able to reach it, so before looking at the weaknesses themselves, we need to understand what an attacker in this environment is actually after, because in a warehouse, the blast radius extends well beyond data. Everything we just traced — the systems, the devices, and the people operating them — exists to keep goods moving, and attacks in various parts along that chain can affect the business differently. The chart below shows what is at risk in the warehouse and where those risks land for the business. The segment on the left groups them under the three core security properties: integrity, availability, and confidentiality. The segment on the right maps each property to the business outcomes a failure can cause.

    Warehouse risks

    Warehouse risks

    The first area at risk is integrity. Inventory counts, locations, orders, and shipment data must stay in sync with the physical world. Corrupting a record silently desynchronizes the operation, and because the eight stages form a dependency chain, one falsified entry early on is inherited downstream, surfacing later as stockouts and mis-shipments. In its deliberate forms, this lets an attacker redirect goods, release stock, and perform other actions on behalf of the platform’s vendors under cover of legitimate records. Integrity is also a safety concern: when people or machines act on information that no longer reflects the physical environment, a data failure can become a physical incident. This is why integrity is the only property linked to all five outcomes, including harm to people.

    The second is availability, the warehouse’s ability to keep goods moving. Halting a conveyor, a sorter, label printing, or the WMS stops orders from shipping, and in a business built on speed, every hour of downtime means delayed deliveries and broken promises. Ransomware can bring the whole warehouse to a standstill. The impact shows up as operational disruption, lost revenue, and reputational damage.

    The third is confidentiality. Customer data, business records, and system credentials are valuable targets. Their exposure leads to legal liability and reputational damage, and stolen credentials often open the door to further attacks. Where the WMS connects to financial or ERP processes, the risk extends to theft of funds.
    Knowing what is at risk tells us what an attacker stands to gain; the next question is who is in a position to take it. Threat actors differ in the access they already hold. For example, an attacker may be authenticated and privileged, have limited physical or remote access, or have no legitimate access to the environment at all. Based on their relationship with the warehouse and their level of access, threat actors can generally be divided into two categories:

    1. External. An attacker with no legitimate relationship with the warehouse or the organization, operating without authorized access. External attackers can be divided into two categories based on their physical proximity to the environment:
      1. Remote. An attacker operating from outside the site’s physical area, reaching the environment through whatever the organization exposes or makes reachable over the internet, including web services, remote access infrastructure, and third-party connections used by suppliers, carriers, and integrators.
      2. Proximate. An attacker with no legitimate access who has nevertheless moved within physical range of the site’s locally reachable technologies. They may, for example, be in a parking lot, a neighboring unit, or a delivery bay. Their proximity may allow them to interact with wireless, radio, Bluetooth, or other short-range interfaces without possessing an account, badge, employment relationship, or other authorized access.
    2. Internal. An individual with legitimate access to the warehouse, its systems, or its information, who intentionally or unintentionally creates a security risk. This includes employees, administrators, operators, contractors, and temporary staff.

    Combining these threat actors and their access levels with the risks identified earlier, the vulnerabilities present in each system, the resulting attack surfaces, and the potential attack paths between them provides a threat model for the warehouse environment. This allows an organization to understand how different systems and people could be targeted, how individual weaknesses could be combined, and where security controls are most needed.

    Cornering the unicorn

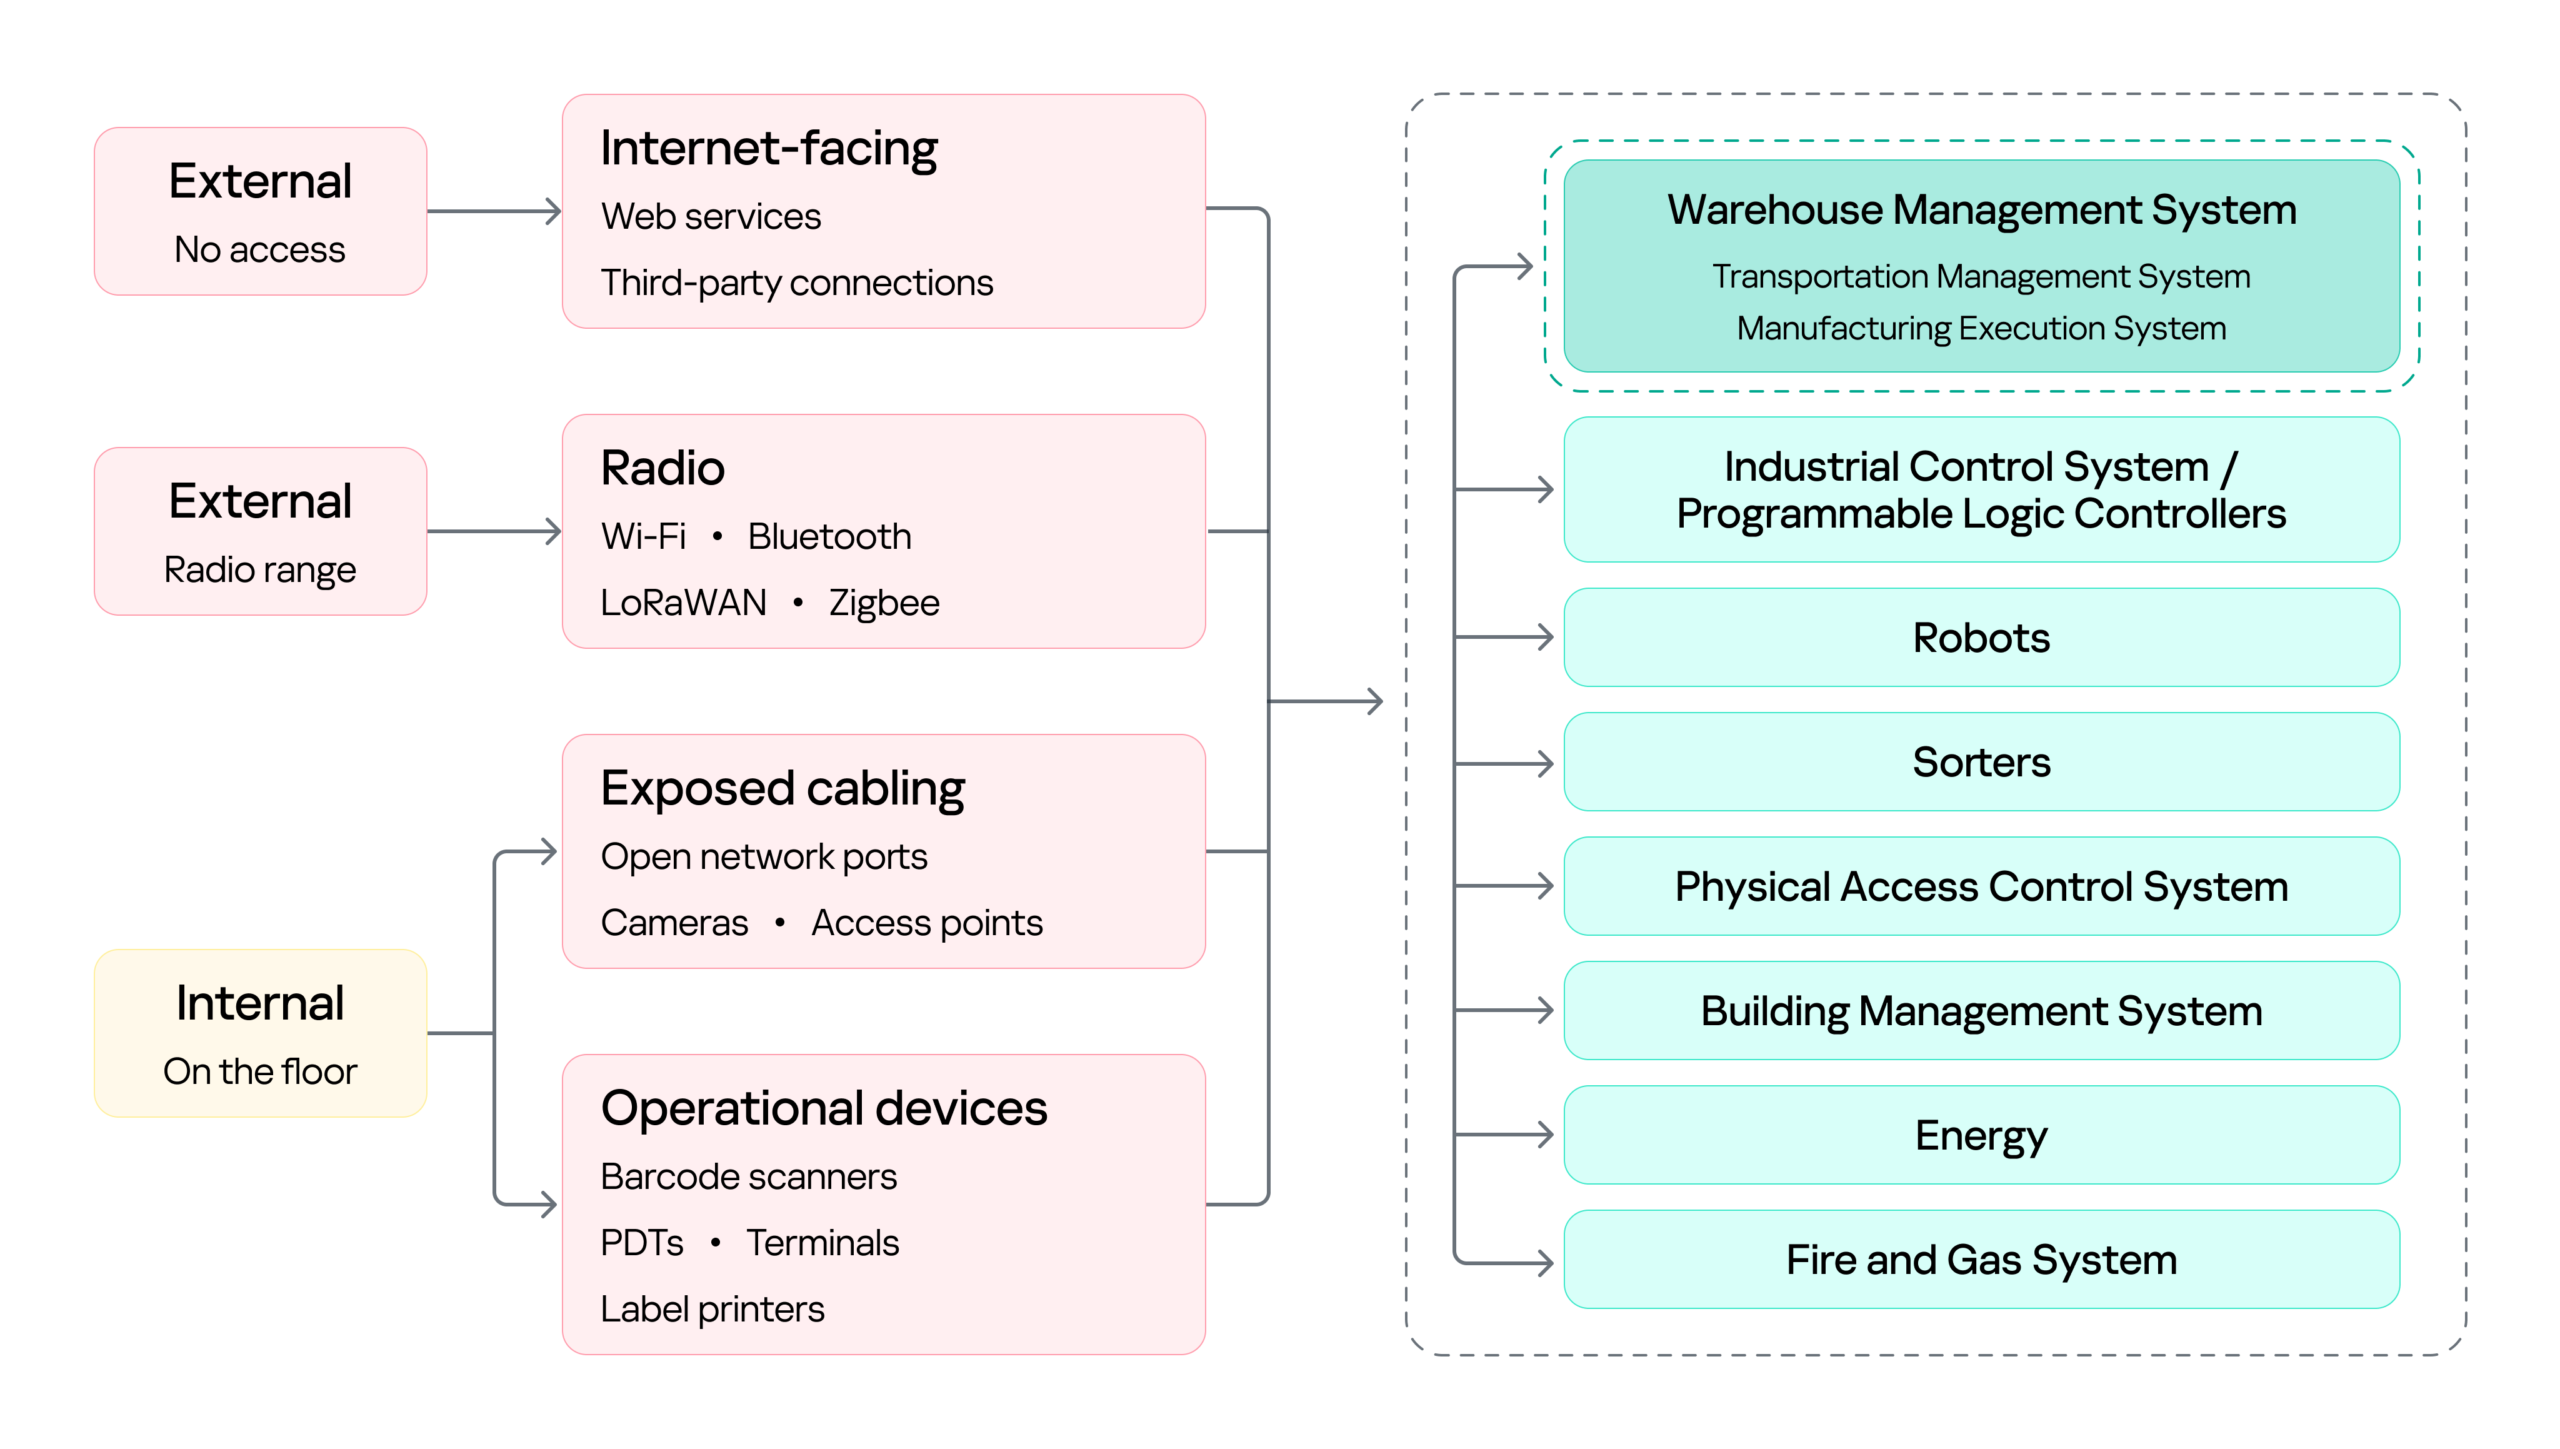
    Knowing what is at risk and who might come after it still leaves the most practical question open: how they would actually get in, and how far they could go once they did. The diagram below sets out the warehouse’s attack surface: every point where an attacker can get in, organized by the access that reaching each point requires.

    Warehouse attack surface

    Warehouse attack surface

    On the left are the attacker categories discussed above, distinguished by where they stand and what access they already hold. Each reaches the environment through a different set of entry points, and the impact of a successful attack can land on several systems, from the WMS to OT systems such as robots, sorters, and physical access control system (PACS). The WMS is highlighted because it is the most significant of these: it coordinates the OT systems, so compromising it can affect the entire operation rather than a single process.

    Next, we will cover the initial access vectors, the points a threat actor can use to reach the warehouse environment. Following that, we turn to the impact on the logistics processes themselves, focusing on the WMS, since its compromise affects every logistics operation that depends on it.

    Initial attack vectors

    Internet-facing services

    Remote access through internet-facing services, third-party connections, and corporate networks gives an external attacker a foothold on the warehouse network infrastructure. It is a well-covered problem and not specific to this environment, so we note it here as an entry point but will not examine it further.

    Wi-Fi, Bluetooth, and other radio channels

    Wi-Fi connects handhelds, tablets, printers, cameras, and workstations. Bluetooth serves scanners, headsets, and positioning beacons. Zigbee and similar low-power protocols run lighting, sensors, and building automation, while LoRaWAN carries telemetry over long distances. Cellular provides a backup channel for kiosks and contractor equipment, and proprietary protocols control industrial panels and specialized machinery.

    Radio passes through windows, gates, roofing, and thin external panels, so a network built for receiving and processing goods may be reachable from the parking lot and, with a directional antenna, from considerably farther away.

    That reach matters in two ways. It gives an external attacker a place to start, as proximity alone is enough to reach the Wi-Fi and the low-power protocols, and from there to gain an initial foothold in the warehouse networks.

    However, radio does not only lead into the network. It also connects directly to the field devices and carries the live control traffic of warehouse operations, which makes availability a first-order concern. If hundreds of handhelds lose their connection at once, picking stops. If an AGV loses its control channel, the safe reaction may be to halt in place, and a stopped machine can block an entire route.

    Physical network

    The scale of the warehouse itself is part of the attack surface. A fulfillment warehouse can run up to tens of thousands of square meters, with racking climbing several stories and walkways threading through it. Structured cabling runs along that racking, cameras and access points are mounted on that, and wall jacks sit behind pallets that have not moved in months. Almost none of it is in anyone’s line of sight.

    That gives a person in the warehouse something a normal office does not: unsupervised access to live network infrastructure. Unplugging a ceiling camera leaves an active port. An unused jack behind a shelf leaves another. Neither requires tools, credentials, or any interaction with a system that logs anything. And since the camera or access point sits on the same segment as the rest of the site, the compromised port, not being isolated, opens a path to the network core.

    Barcode scanners

    Barcode scanners are everywhere in a warehouse. They are the main tool workers use to tell the system what is moving and where, supporting receiving, picking, packing, and inventory management. A typical setup has handheld scanners communicating with a base station, which is in turn connected to a workstation or another business system.

    This makes the scanner an entry point into the core network in two ways.

    First, through the barcode itself. Since the scanner acts as a keyboard to the connected host, a maliciously crafted barcode or QR code can inject keystrokes when scanned, potentially giving the attacker an initial foothold on the host without directly accessing the network.

    Second, through the scanner’s wireless link. During a customer engagement, with the provided test stand of such a device, we discovered that an attacker within range could inject keystrokes into the connected host and potentially achieve remote code execution without user interaction. This attack pattern was observed across multiple vendors, including, for example, Honeywell devices affected by CVE-2026-4272.

    In both cases, the result is the same: a foothold on a host inside the warehouse network. The scanner is simply the entry point; the significance of that foothold comes from the host’s trusted position within the operational environment and its connectivity to core systems.

    Portable data terminals

    Portable data terminals (PDTs) are essentially ordinary Android devices with an embedded barcode scanner, carried by workers to scan items; each scan is passed to a dedicated application that forwards it to a remote server over an API. To keep workers on task, the devices usually run in kiosk mode, locking the user to that single application and preventing interaction with the rest of the Android system.

    That lockdown is exactly what an attacker wants to break, and breaking it is what turns the terminal into an initial access vector: escaping the kiosk can expose the Wi-Fi password of the network the terminal is connected to, or allow malicious software to be installed that gives the attacker remote access to the network over the internet.

    Printers

    Warehouses contain different types of printers. Alongside the usual IT printers used for documents and paperwork, there are specialized thermal printers, small devices that use heated elements on the printhead to create labels, barcodes, and tags. As we mentioned earlier, these are mainly used to print the labels, usually containing barcodes, that are attached to goods during the putaway stage.

    Here we focus on mobile thermal printers: small, battery-powered devices that workers can carry or wear. They typically connect to the internal network over Wi-Fi to receive print commands, while also supporting Bluetooth for connecting to nearby devices. This combination makes them a potential entry point into the internal network.

    Some models, such as the Zebra ZQ630, support multiple interfaces and can run applications directly on the device. During a security assessment, we discovered that apps can be uploaded and executed over Bluetooth. By exploiting a pairing misconfiguration, an attacker within Bluetooth range could bypass pairing, upload malicious software, and gain an initial foothold through the printer.

    Impact on logistics processes (attacks on WMS)

    With a foothold in the network, an attacker can pivot to the logistics processes themselves: from the WMS through the warehouse infrastructure to the PLCs and the machinery they drive. As we saw earlier, all OT systems and devices are interconnected and the WMS sits at the head of that chain: it is the system of record every other process reads from and writes to, so compromising it reaches all of them at once. That, and its being specific to this environment, is why it is the focus here.

    Warehouse management systems (WMS) are the software platforms that optimize warehouse processes from the entry of goods to their exit. They provide real-time visibility into inventory and orchestrate end-to-end fulfillment by integrating with many warehouse subsystems and pieces of automation equipment, such as conveyors, PLCs, robotics, scanners, and voice systems. A typical WMS includes modules for receiving, inventory control, order management, labor management, shipping, and reporting. Major vendors include SAP EWM, Oracle Warehouse Management, Manhattan Active, Blue Yonder, Infor, Körber/HighJump, Microsoft, and TECSYS.

    To picture how central this is, think back to our unicorn. From the moment it was scanned at receiving, it stopped being only a physical box and became a record inside the WMS, a record the system then used to decide where it should be stored, when it should be picked, how it should be sorted, and where it should ship. Every device employed along the way — the PDT at receiving, the printer at putaway, the workstation at picking, the conveyor at sorting — was really just talking to the WMS. It is the thread that ties all eight stages together, which is exactly what makes it such a valuable target.

    Because modern WMS platforms are usually web-based and heavily interconnected, they inherit common web and API vulnerabilities alongside flaws specific to the WMS itself. A recent example is CVE-2026-70774 in Oracle Warehouse Management, part of Oracle E-Business Suite. Oracle rated it High and described it as an easily exploitable authorization bypass flaw in which a low-privileged attacker with network access can compromise the application, affecting integrity and availability by allowing unauthorized creation, deletion, or modification of critical data.

    A flaw like this may look like a typical web application issue, but its consequences in a warehouse are more serious, because the WMS is the system of record. If an attacker can modify its data, they can alter stock levels, bin locations, receiving records, picking tasks, or shipment information, silently corrupting the digital twin of the warehouse. And since the eight stages form a dependency chain, that corruption doesn’t stay contained: a falsified record at receiving is inherited by putaway, picking, and everything downstream. The physical box and its record diverge, and every later process trusts the record.

    The most direct version of this attack comes from an authorization bypass flaw like the Oracle vulnerability above. Here the threat actor can be an external attacker who has reached the application over the network, or an insider such as a low-privileged operator or storekeeper who already holds a legitimate account.

    The danger grows when such a flaw is chained with others. An external attacker who combines remote code execution with SQL injection could generate shipment orders to arbitrary addresses together with the documents needed for goods to physically leave the warehouse, fabricate waybills, acceptance or transfer records, and registers, while also exposing customer data such as names and delivery addresses. In effect, the goods are sent out with legitimate-looking paperwork.

    This is why ordinary web vulnerabilities carry considerable weight in a WMS. For an external attacker or an insider probing beyond their assigned role, broken access control could open a path into another warehouse zone, allow manipulation of other workers’ tasks, permit unauthorized exception operations, or expose administrative APIs. A server-side request forgery flaw could force the WMS server to reach resources an external attacker cannot touch directly, and if the network is flat or only formally segmented, that server may in turn reach internal management panels, cloud service interfaces, or systems sitting close to the operational network, turning a single web bug into a bridge between IT and OT.

    Attacks on a WMS don’t always target the application directly, though. As we saw while tracing the unicorn, the warehouse is full of connected devices that already hold trusted access. A handheld terminal carries authenticated WMS API access as a matter of course, and anyone who gains control of that terminal inherits it (by escaping the kiosk, for example). Depending on the device’s permissions, that might mean confirming picks that never occurred, falsifying receiving operations, adjusting stock counts, or marking orders complete — something warehouse employees themselves could use to avoid their assigned duties.

    Where the WMS is connected to control and automation systems, access to the WMS can extend into physical operations, including conveyors, sorting systems, lifts, doors, and pumps.

    PLCs translate WMS instructions and sensor inputs into physical actions. Compromising a system that controls them therefore creates an opportunity to manipulate those actions. The impact can be as simple as a sorting diverter sending boxes down the wrong route, a conveyor repeatedly entering an error state and creating a backlog, or a falsified sensor value causing a line to be treated as clear when it is full.

    However the WMS is compromised, the business consequence is the same: inventory corruption, unauthorized shipments, and operational disruption, each reaching the customer in the end as a late or missing delivery, the wrong item in the box, or a personal address exposed to a stranger.

    Securing the unicorn

    We followed our unicorn through web applications and databases, radio channels and PDTs, printers, conveyors, robots, and the loading zone. Because warehouse environments combine IT, OT, wireless, physical, and human components, security controls should be implemented as a single, coordinated security architecture rather than as isolated measures. Network segmentation should be a foundational control, with clear separation between corporate IT, warehouse OT, operational devices, management networks, and externally connected systems. Segmentation should also extend across facilities and customer environments so that each site and customer integration is isolated from the others, limiting the potential impact of a compromise. A zero-trust approach should reinforce this architecture by requiring explicit authentication and authorization for connections between systems, regardless of their network location, and by applying least-privilege access wherever possible. Regular penetration testing of the corporate IT environment, including domain services, identity infrastructure, and endpoints, should be incorporated into the warehouse security program.

    Physical and network access controls should be implemented together. Access to warehouse facilities, network rooms, communication cabinets, and operational areas should be restricted according to business need, with appropriate authentication, monitoring, and access logging. Network infrastructure should be hardened through controls such as switch port security, MAC-based access restrictions where appropriate, and IEEE 802.1X with EAP-TLS for strong device and user authentication. Network equipment should also be securely configured and regularly reviewed to ensure that unused interfaces, insecure management protocols, default credentials, and unnecessary services are disabled.

    Web applications and their supporting infrastructure should be governed through a secure software development lifecycle (SSDLC), including security requirements, secure coding practices, code and dependency review, and application security assessment before deployment and throughout the application’s lifecycle. Third-party applications and components should be continuously monitored and updated, with a defined vulnerability and patch management process. This should explicitly include warehouse management systems (WMS), warehouse portals, APIs, and other applications that provide operational or customer-facing functionality.

    Wireless technologies should be subject to dedicated security assessment and engineering. Radio-frequency surveys should be conducted to establish expected coverage, identify unauthorized or unexpected signals, validate the availability and protection of operational communications, and determine whether wireless deployments create unintended access paths into warehouse networks. Wireless security should be assessed not only from a connectivity perspective but also in terms of authentication, encryption, device provisioning, protocol exposure, interference resilience, and the potential impact of unauthorized devices.

    Warehouse operational devices should be incorporated into the organization’s endpoint security and vulnerability management processes. Devices should receive security updates and firmware patches on a defined schedule, with accelerated remediation for critical vulnerabilities. Security assessments should be performed periodically to identify weaknesses in device configuration, applications, exposed services, and authentication mechanisms.

    Personnel security should form an additional layer of the warehouse security architecture. In most industrial and ICS environments, getting inside means clearing background checks, holding relevant qualifications, or proving prior experience; the hiring process itself acts as a filter. A warehouse is different. Roles in sorting, packing, and courier work are hired quickly and in volume, and they typically require no prior expertise, certification, or specialized background at all. An ordinary person can walk in off the street, be hired within days, and immediately hold legitimate physical access to the facility. Therefore, a more restrictive and risk-based approach to hiring should be considered, particularly for roles that provide access to sensitive areas, operational systems, network infrastructure, or customer assets.

    Ultimately, all of these measures serve the same objective: protecting the continuity and reliability of the warehouse as a whole. This matters because real warehouses handle food, medicines, machine parts, and the millions of ordinary things people and companies depend on every day. Protecting their journey means seeing the warehouse as it has actually become: a single digital system with doors, motors, shelving, and radio signals, and with entirely real consequences when it fails. And if the security program works, the customer never knows any of this happened. The unicorn simply arrives at the scheduled time.

    If your warehouse operations rely on interconnected systems like these, we can help identify the gaps before an adversary does. Reach out to discuss a security assessment.

    Source: Securelist (Kaspersky GReAT) · 2026-10-20